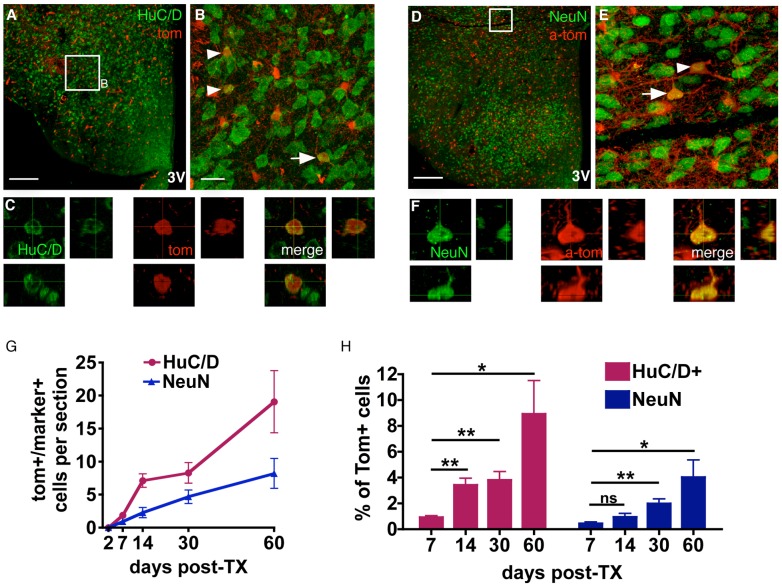
Figure 4. NG2-glia differentiation to the neuronal lineage.
Confocal images of sections from mice perfused 30 days post-TX were stained with antibodies against the neuronal markers Hu (A–C) and NeuN (D–F). In (D–F) Tom signal is enhanced by co-labelling with an anti-Tomato (a-tom) antibody. Arrows and arrowheads mark colabelled cells. Cells marked by arrows are reconstructed in 3D from a z-stack of confocal images (C,F). (G,H) Quantification of Tom+/NeuN+ and Tom+/Hu+ cells at 2, 7, 14, 30 and 60 days after initiation of TX treatment, shown as absolute numbers (G), and as a proportion of all Tom+ cells (H). B, E maximum intensity projections of confocal Z-stacks. All graphs show mean ± SEM; n = 6; scale bars = 20 µm (B,E) or 200 µm (A,D). Student’s T-test, *p<0.05, **p<0.005, ns = not significant.

