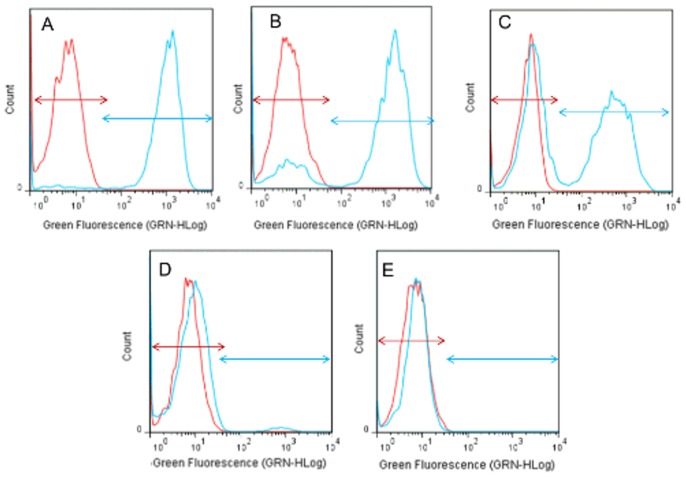
Figure 3. FCM histograms of S. cerevisiae S288C cells stained with FDA.
The cells were incubated with 25/L natamycin in Synthetic wine at 28°C. After 30 (B); 60(C); 120(D) and 150(E) min, the cells were collected, and the cell Green fluorescence intensity was analyzed by FCM, Panel A represents control cells in the absence of SO2 (0 min). The Green fluorescence intensity (GRN-HLog) is represented on the x-axis, and cell counts are represented on the y-axis. Panels show the fluorescence of S. cerevisiae S288C before (red arrow; self-fluorescence) and after (blue arrow) staining with FDA. One representative experiment of the three performed is shown.

