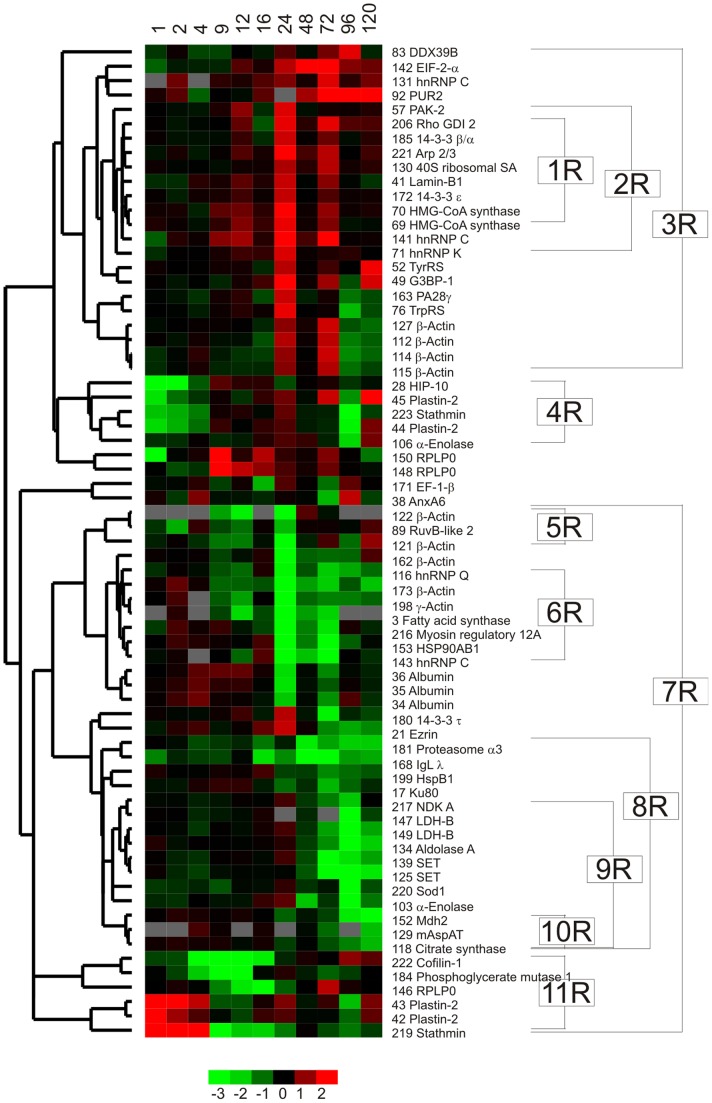
Figure 4. Unsupervised clustering of proteins affected by anti-IgM stimulation.
The heat map shows the comparison between anti-IgM stimulated and control Ramos samples during the time course 1–120 h. Protein abundance difference is calculated between stimulated and corresponding control samples for the 69 identified proteins, which passed the significance criteria (student’s t-test p≤0.05). Red and green colours indicate up- and down-regulation in response to anti-IgM stimulation (base-two logarithmical scale below the figure). Cluster numbers (1R-11R), short protein names and SSP are shown to the right and refer to those in Table 1, Table 2, Table 3, Table S2 and Table S4.

