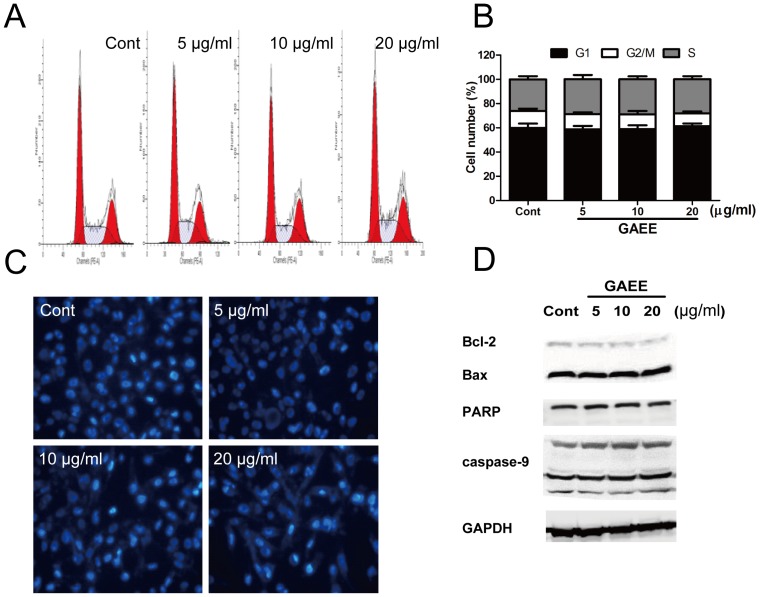
Figure 2. Effects of GAEE on cell cycle progression and apoptosis.
(A, B) The cell cycle distribution in MDA-MB-231 cells after treatment with GAEE. Data were shown as mean ± SEM of four independent experiments. (C) Cells were exposed to various concentration of GAEE for 24 h, nuclear morphology was observed by the Hoechst-33342 staining. (D) MDA-MB-231 cells were treated with GAEE for 24 h and the protein levels of Bcl-2, Bax, PARP, and caspase-9 were examined using Western blot analysis. GAPDH was used as a loading control.

