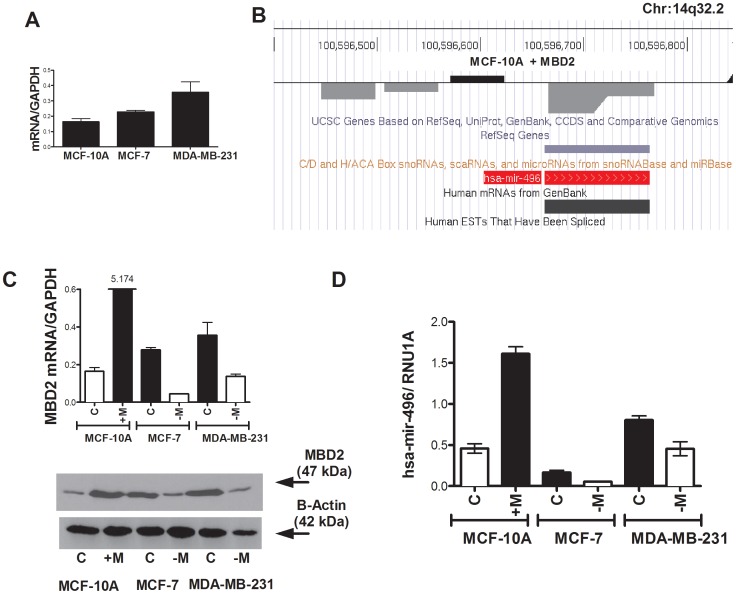
Figure 1. Depletion of MBD2 in mammary breast cancer cell lines leads to induction of hsa-mir-496 expression.
(A) qPCR of endogenous MBD2 mRNA in MCF-10A, MCF-7 and MDA-231. (B) A track showing the position of demethylated probes (descending grey bars) in the hsa-mir-496 promoter region as determined by MeDIP enrichment for methylated DNA and hybridization to a genome wide promoter array. (C) qPCR of MBD2 mRNA levels in MBD2 transfected (black) MCF-10A and controls (empty), and siRNA-MBD2 treated MCF-7 and MDA-231 cells (empty boxes) and controls (black boxes). Bottom panel is a Western blot analysis with an anti MBD2 antibody (D) qPCR quantification of hsa-mir-496 in MBD2 transfected (black) MCF-10A and controls (empty), and siRNA-MBD2 treated MCF-7 and MDA-231 cells (empty) and controls (black).

