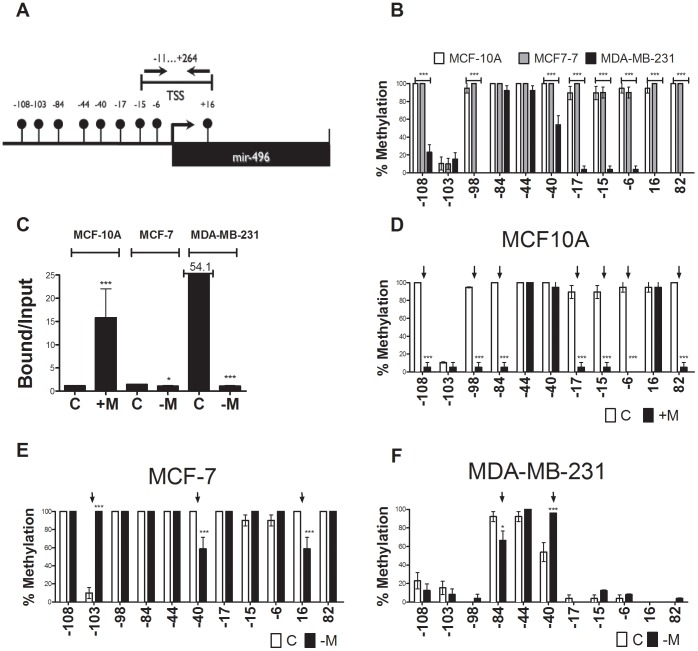
Figure 2. MBD2 overexpression in MCF-10A cells induces hsa-mir-496 expression and demethylation through binding to the TSS.
(A) Physical map of the 5′ region of hsa-mir-496. The balloons represent CG dinucleotide sequences. The transcription start site TSS is indicated. The position of primers used to amplify in qChIP analysis the are indicated. (B) Results of bisulfite mapping of the 5′ hsa-mir-496 in MCF-10A (empty), MCF-7 (grey) and MDA-MB-231 cells (dark) (C) qPCR ChIP of MBD2 in MCF-10A, MCF-7 and MDA-MB-231 with primers as outlined in panel A. MCF-10A [C], MCF-10A expressing ectopic MBD2 [+M], MCF-7 Control [C] and MBD2 depleted MCF-7 cells [-M], Control [C] and MBD2 depleted [-M] MDA-MB-231 cells with primers as outlined in panel A (D) Results of bisulfite mapping of the 5′ hsa-mir-496 in MCF-10A (empty) [C] transfected with MBD2 (black). (E) Results of bisulfite mapping of the 5′ hsa-mir-496 in MCF-7 cells (empty) or MBD2 depleted MCF-7 cells (Dark). (F) Results of bisulfite mapping of the 5′ hsa-mir-496 in MDA-MB-231 cells (empty) or MBD2 depleted MDA-MB-231 cells (Dark).

