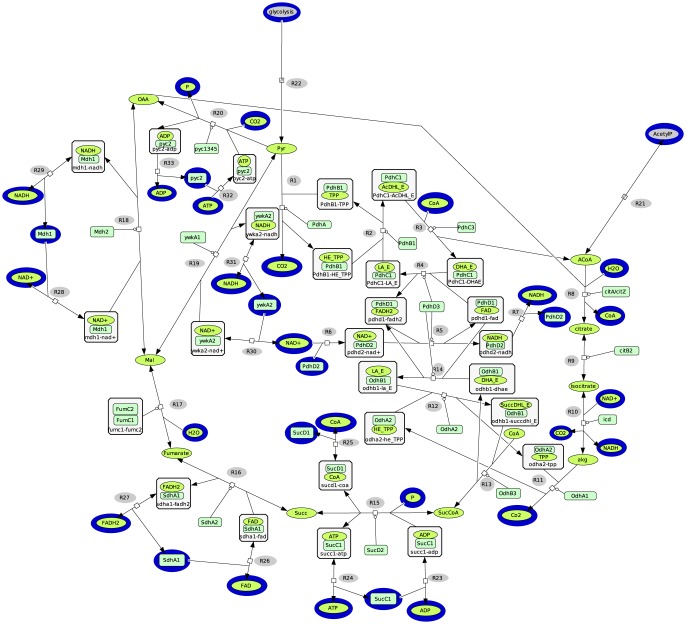
Figure 3. Functional domains network of the TCA cycle.
The rectangular nodes represent the enzymes' domains and the oval nodes represent the metabolites. The external nodes are surrounded in a blue compartment. The symbol  represents the catalytic activities on the reactions. The functional domains network contains the PDH (R1–R7), the citrate synthase (R8), the aconitase (R9), the isocitrate dehydrogenase (R10), the α–ketoglutarate dehydrogenase (R11–R14, R5–R7), the succinyl-CoA synthetase (R15), the succinate dehydrogenase (R16), the fumarase (R17), the malate dehydrogenase (R18), the malic enzyme (R19), the pyruvate carboxylase (R20), the input of Acetyl-CoA from AcetylP (R21), the input of pyruvate from the glycolysis (R22), the binding of ATP/ADP with SucC1 (R23–R24), the binding of CoA with SucD1 (R25), the binding of FAD/FADH2 with SdhA1 (R26–R27), the binding of NAD+/NADH with Mdh1 (R28–R29), the binding of NAD+/NADH with ywkA2 (R30–R31), the binding of ATP/ADP with pyc2 (R32–R33).

