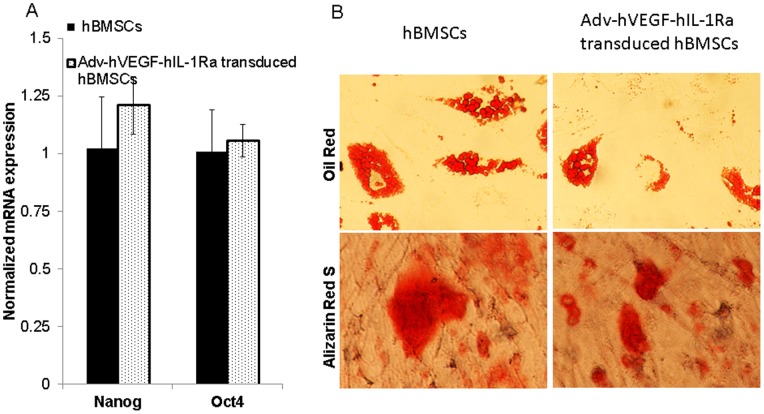
Figure 2. Expression of stem cell markers and differentiation of hBMSCs after transduction with Adv-hVEGF-hIL-1Ra at 200 MOI.
(A) Real Time RT-PCR analysis to quantify change in the expression of Nanog and Oct4 stemness markers. Data are represented as the mean ± SD, n = 3. (B) Oil Red and alizarin red S staining of hBMSCs after culture in adipogenic and osteogenic differentiation media, respectively.

