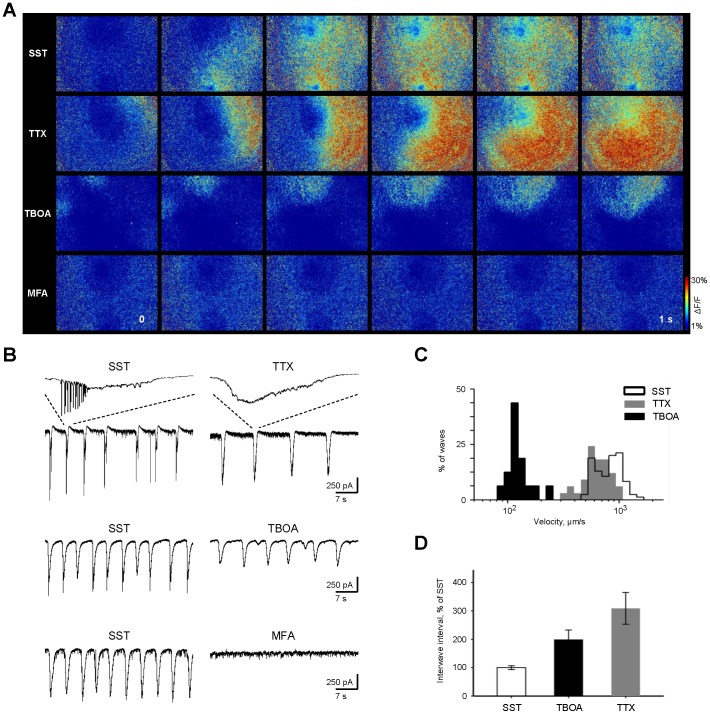
Figure 4. Contribution of sodium channels, glutamate spillover and gap junctions to propagation of adult retinal waves.
A: ΔF/F pseudo colored time-lapse images showing 1 s of retinal activity under different pharmacological conditions, illustrating the contribution of voltage-gated sodium channels, glutamate transporters, and gap junctions, respectively, to SST-induced adult retinal waves. Size of the retinal region in each panel is 636×1130 µm. B: Compound sEPSCs recorded from GCs under different pharmacological conditions. In the top panel, the inset highlights the selective blockade of spiking activity following application of TTX. For illustrative purposes, these recordings were obtained using a recording pipette with higher input resistance, to reveal spiking activity along with currents. Compound sEPSCs persisted under TTX and TBOA, but were abolished under MFA. C: Cumulative histogram of wave velocities under SST (transparent bars, black outline), TBOA (black bars), and TTX (gray bars). Velocities following TBOA and TTX are significantly slower than under SST alone (ANOVA, Bonferroni post-hoc tests, p>0.0001 and p = 0.0067, respectively). D: Bar graph of interwave intervals under different pharmacological conditions. Intervals following TBOA and TTX are significantly longer than under SST alone (ANOVA, Bonferroni post-hoc tests, p = 0.0016 and p>0.0001, respectively). All data are reported as means ± SEM. See Supplementary Videos S5-88 for ΔF/F pseudo color recordings of the effect of TTX, TBOA, and MFA on waves.

