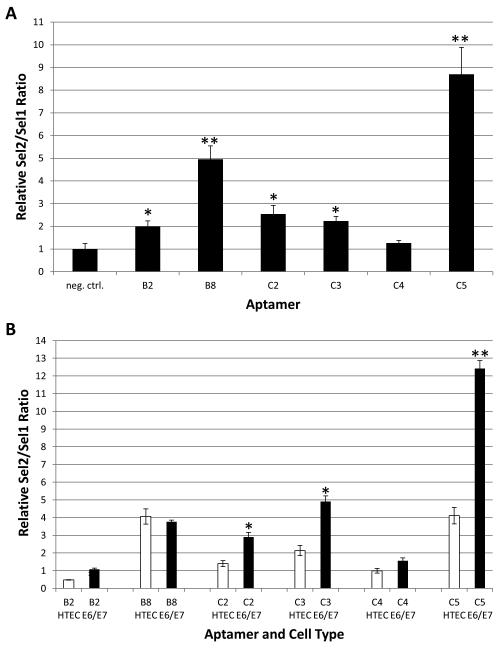
Figure 4. Internalization of individual aptamers into cells.
A. The individual aptamers were incubated with the 16E6/E7 HTECs to allow for binding and internalization, followed by stringent washing, isolation of RNA, and quantification as described in the Materials and Methods. The quantity is displayed as the ratio of the aptamers (Sel2) over an internal spiked control (added after Trizol extraction) called Sel1 all normalized to GAPDH (measured from a separated non-RNAse treated fraction) and compared to internalization of a negative control aptamer (*=p<.05; **=p<.01, Student’s t-test). B. Internalization of individual aptamers into 16E6/E7 HTECs (E6/E7) as compared to internalization into primary HTECs (HTEC). Experiments and quantification were performed as in A (*=p<.05;**p<.01, Student’s t-test comparing internalization into E6E7 with internalization into HTEC).

