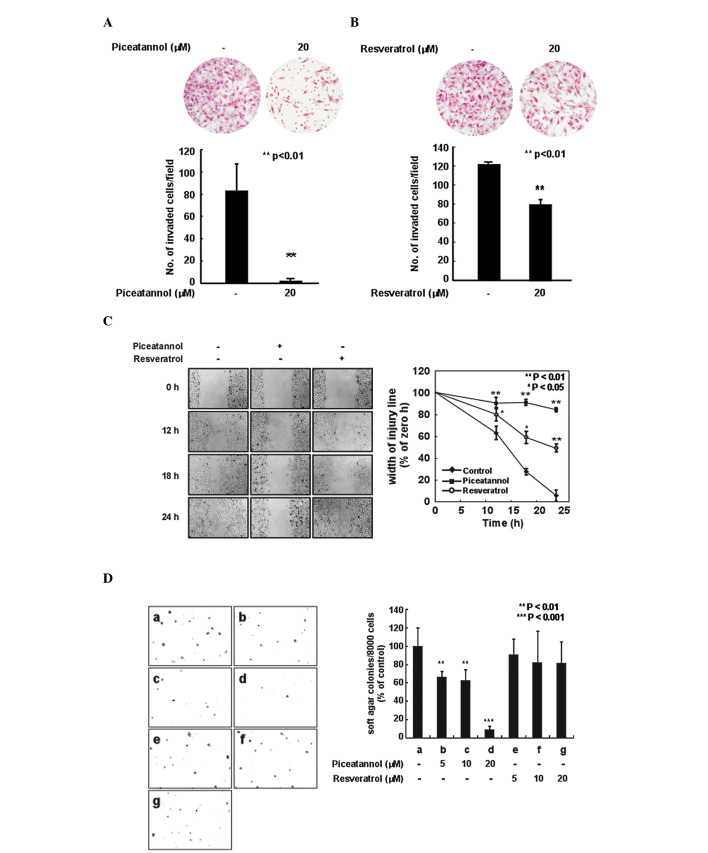
Figure 2.
Inhibitory effects of piceatannol and resveratrol on the invasion, migration and neoplastic transformation of H-ras MCF10A cells. (A and B) Invaded cells were quantified by counting the cells that migrated to the lower side of the filter in random microscopic fields. Each bar indicates the mean ± SD (n=3). *p<0.05, **p<0.01 compared with the control. (C) Confluent H-ras MCF10A cells in serum-free medium were treated with resveratrol or piceatannol. Thereafter, the widths of the injury lines were measured at 0, 12, 18 and 24 h. Results are expressed as the widths of the injury lines relative to the untreated controls at 0 h, as determined from three independent experiments. Data are the means ± SD. (D) Comparison of the inhibitory effects of piceatannol and resveratrol on the H-ras-induced neoplastic transformation of MCF10A cells. Cells were treated as described in Materials and methods and the number of colonies was determined 15 days later: (a) untreated control; (b) piceatannol 5 μM; (c) piceatannol 10 μM; (d) piceatannol 20 μM; (e), resveratrol 5 μM; (f) resveratrol 10 μM; (g) resveratrol 20 μM. The colonies were counted under a microscope using Image-Pro Plus software version 4. Data are presented as the mean numbers of colonies ± SD, as determined by three independent experiments. **p<0.01 and ***p<0.001, significant difference between the group treated with piceatannol or resveratrol and the untreated group.

