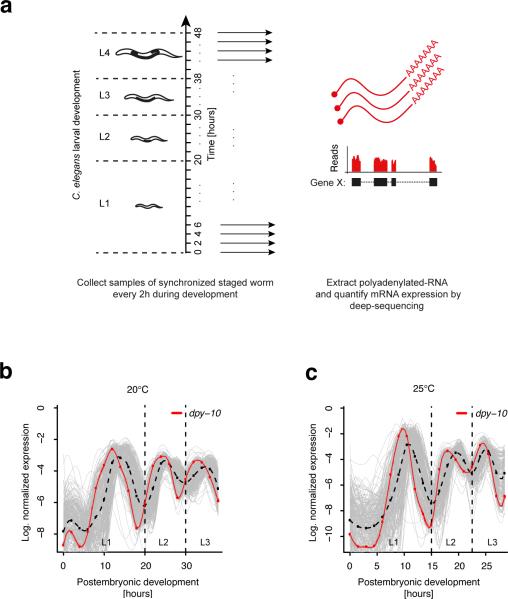
Figure 1. A number of genes display cycling expression dynamics in synchrony with the molting cycle during larval development.
(a) Experimental set-up. After synchronizing hatched worms by starvation, samples were collected every 2 hours (1.5 hours) during larval development at 20°C (25°C). For each sample, transcript expression was measured by poly(A)+ RNA-seq. (b-c) Normalized expression profiles of all 231 genes (grey) that co-cluster with the collagen encoding molting gene dpy-10 (red) known to exhibit periodic expression7. Cycling expression was observed at 20°C (b) and 25°C (c). The average profile is indicated by the broken black line. All curves are spline fits of the discrete expression profiles (red dots for dpy-10). Dashed lines separate larval stages.

