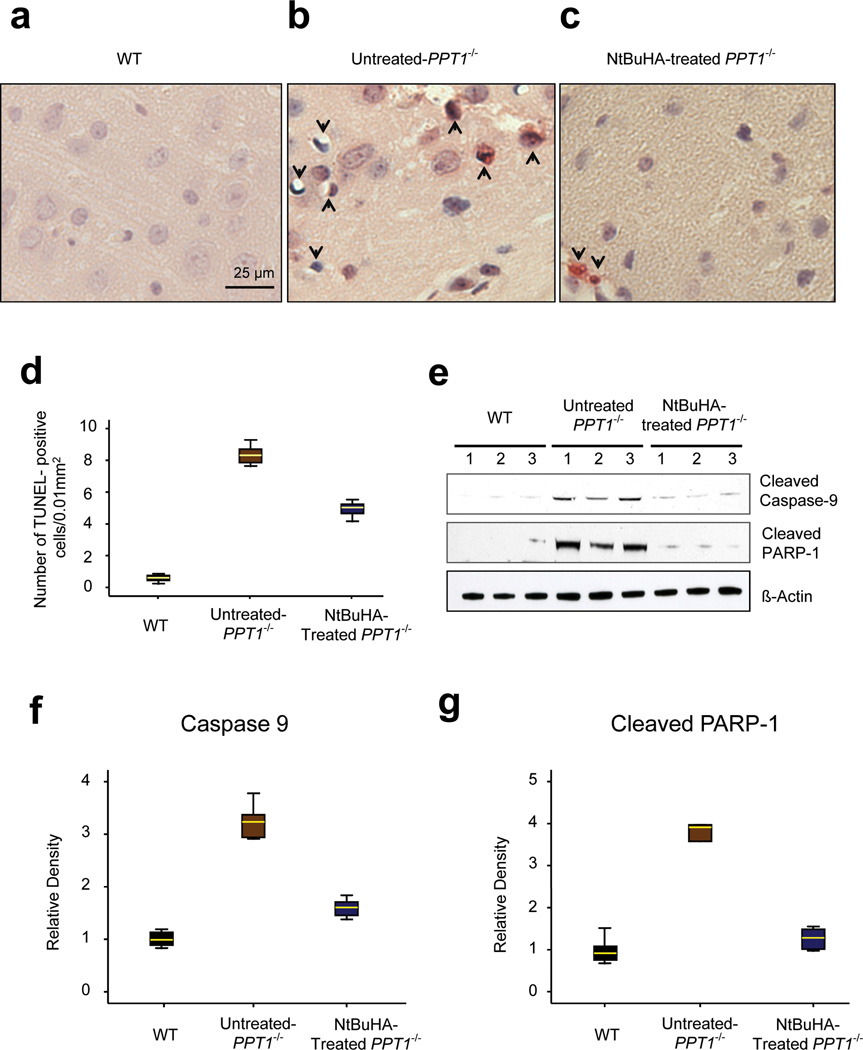
Figure 4.
NtBuHA suppresses apoptosis in Ppt1−/− mouse brain.
Apoptotic cells were detected by TUNEL assay in brain sections (Panel a) from 6-month old WT (n=9); (Panel b) untreated- (n=9) and (Panel c) NtBuHA-treated Ppt1−/− mice (n=12). TUNEL-positive apoptotic cells appear reddish brown. (Panel d) Graphic representation of the levels of apoptotic cells in the brain of WT, untreated- as well as NtBuHA-treated Ppt1−/− mice. (t(16)=27.63, P<0.001, permutation t-test) for WT vs. untreated-Ppt1−/−; (t(19) = 15.74, P<0.001, permutation t-test) for untreated-Ppt1−/− vs. NtBuHA-treated Ppt1−/−. (Panel e) Western blot analysis of cortical tissue homogenates prepared from 6-month old WT, untreated- as well as NtBuHA-treated Ppt1−/− mice for cleaved caspase-9 and cleaved PARP-1. Full-length blots of the cropped gel images used in 4e are provided in Sypplementary Fig. 10a. Densitometric quantitation of cleaved caspase-9 (Panel f) and cleaved PARP-1 (Panel g) from three independent experiments are presented. For panel f, WT vs. untreated-Ppt1−/− (t(10)=11.65, P=0.002, permutation t-test); Untreated-Ppt1−/− vs. NtBuHA-treated Ppt1−/− (t(10) = 8.23, P=0.002, permutation t-test); For panel g, WT vs. untreated Ppt1−/− (t(9) = 5.08, P=0.004, permutation t-test); Untreated Ppt1−/− vs. NtBuHA-treated Ppt1−/−(t(10) =4.73, P=0.015, permutation t-test).

