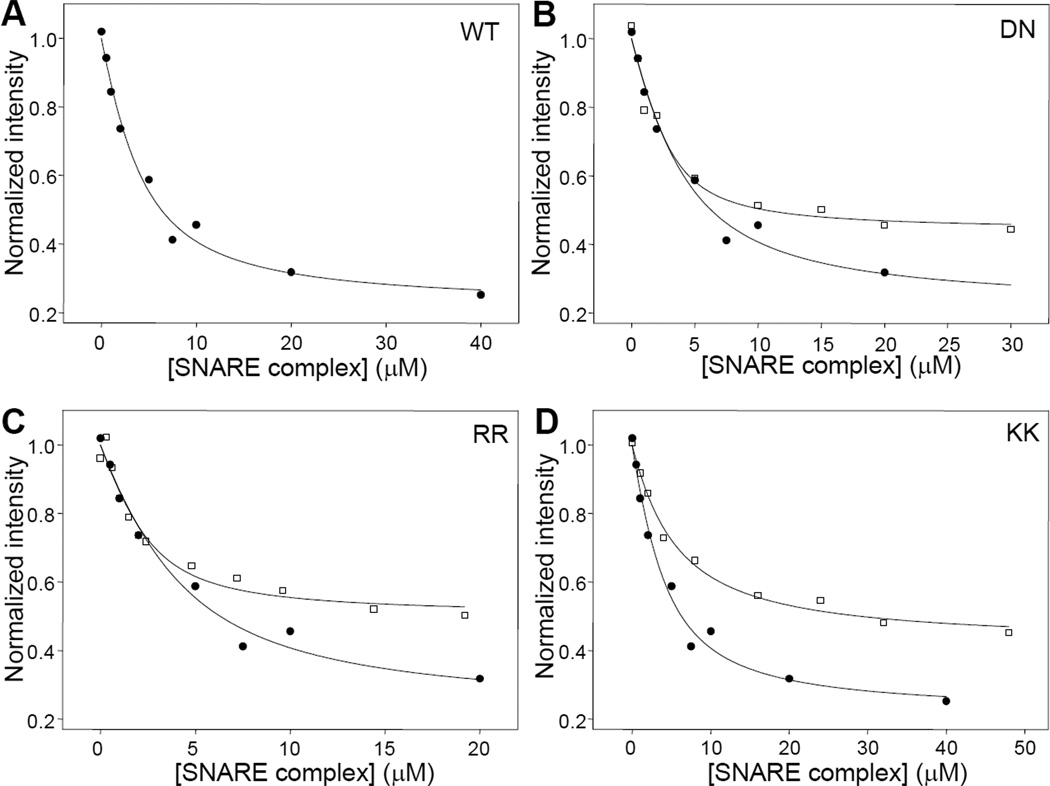
Figure 3.
Titrations of WT and mutant 15N,13C-labeled C2AB fragments with SNARE complex monitored by 1D 13C-edited 1H-NMR spectra. A. Plot of the SMR intensities observed in 1D 13C-edited 1H-NMR spectra of 3 µM WT C2AB fragment as a function of unlabeled SNARE complex concentration in the presence of 1 mM Ca2+. B-D. Plots for analogous titrations performed with DN (B), RR (C) and KK (D) mutant C2AB fragments (open squares), superimposed with a plot obtained for the WT C2AB fragment (closed circles; the same shown in A). The curves show the fits of the data obtained with equation (1).

