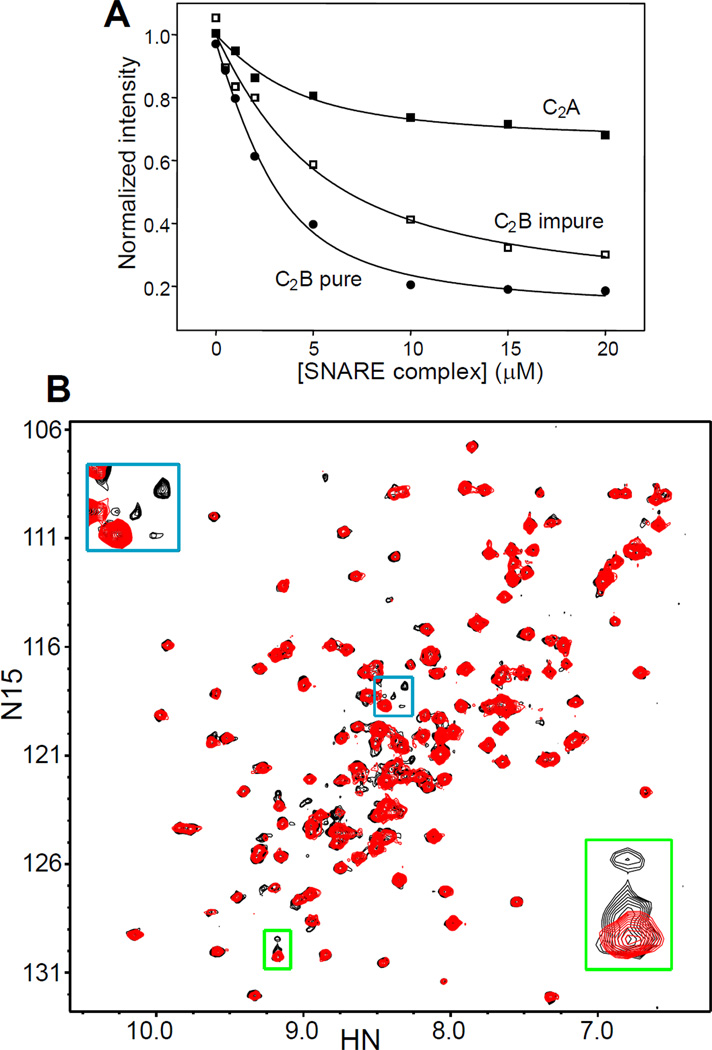
Figure 5.
Analysis of the relative contributions of the synaptotagmin-1 C2 domains to SNARE complex binding. A. Plots of the SMR intensities observed in 1D 13C-edited 1H-NMR spectra of 3 µM synaptotagmin-1 C2A domain (solid squares), pure C2B domain (solid cirlces) and impure C2B domain (open squares) as a function of unlabeled SNARE complex concentration in the presence of 1 mM Ca2+. B. 1H-15N HSQC spectra of synaptotagmin-1 C2B domain that was fully purified (red contours) or that was purified by our standard protocol but omitting the final cation exchange chromatography (black contours). The insets show expansions of regions containing cross-peaks that are unique for the purified C2B domain but exhibit multiplicity in the impure C2B domain [see ref. (49)].

