Figure 5.
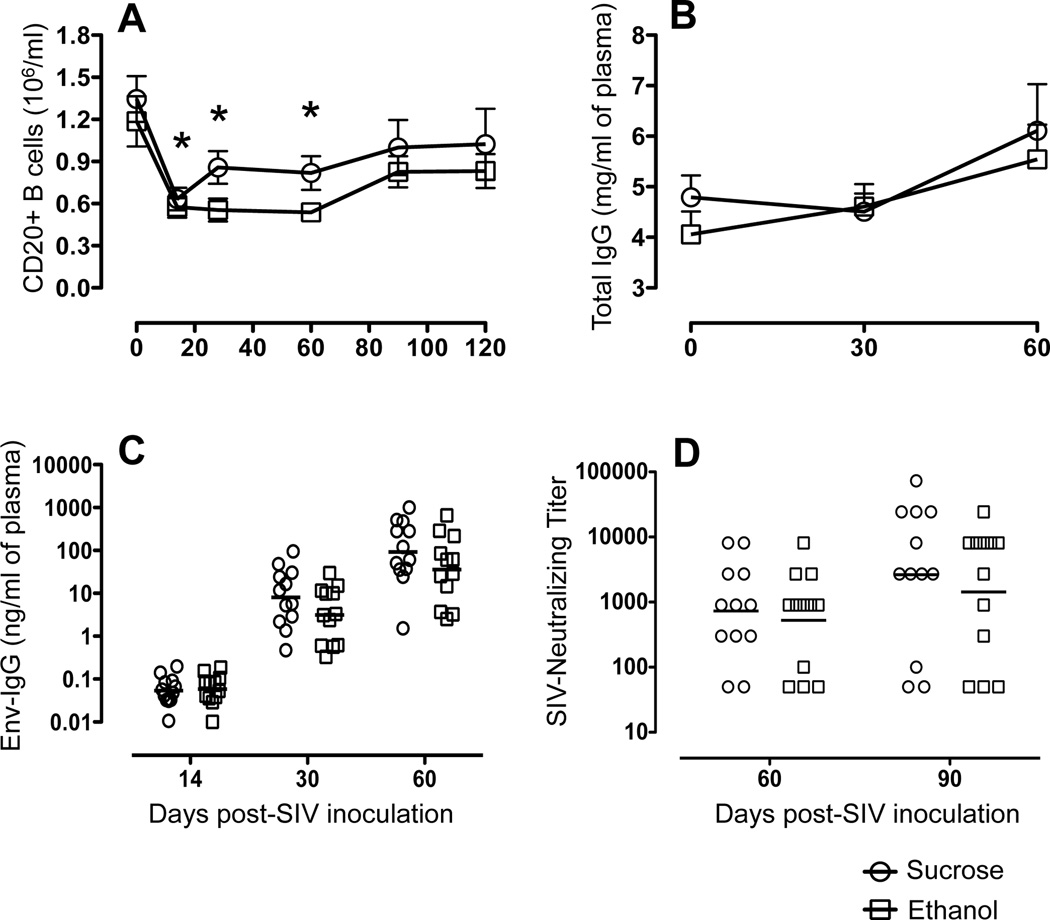
Humoral immune measures over the first 90 days of SIV infection in sucrose (n=12) and ethanol (n=12) treated macaques. (A) Mean ± standard errors for total CD20+ B cell numbers following SIV infection in ethanol and sucrose treated animals are shown. Asterisk (*) indicates significant differences (p<0.05) in CD20+ B-cell population when compared to preinfection timepoints (B) Total plasma IgG levels. Mean and standard error values of total IgG levels measured at 0, 30 and 60 days post SIV infection are shown. (C) Levels of SIV-Envelope-specific IgG in plasma of sucrose and ethanol treated macaques measured over time. Values for individual animals are designated by circles and the geometric mean for each group shown by the line. (D) Plasma neutralization titers. The reciprocal value of the highest plasma sample dilution that reduced infection of SIVMAC239−Cl3env by ≥70% of controls was identified as the neutralizing titer. Values for individual animals are designated by circles and the geometric mean of each group by the line.

