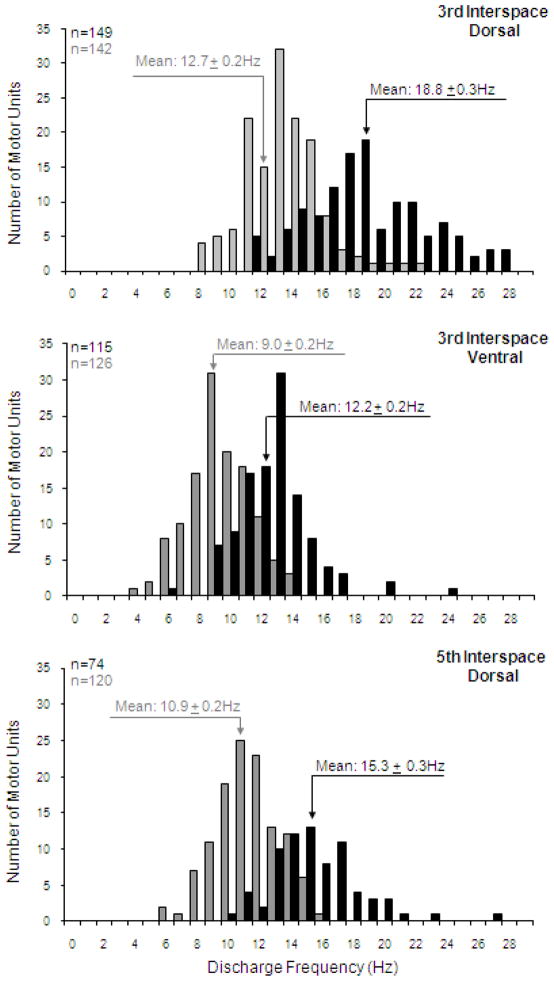
Figure 5.
Histograms of the discharge frequencies of all single motor units identified in the dorsal portion of the 3rd interspace (upper panel), ventral portion of the 3rd interspace (middle panel) and dorsal portion of the 5th interspace (lower panel) during spontaneous breathing (grey bars) and during HF-SCS (dark bars). Bin width, 1 Hz. Recordings were obtained under conditions in which inspired volume during HF-SCS was matched to inspired volumes recorded during spontaneous breathing by adjustment of stimulus amplitude. Note that mean peak firing frequencies were significantly higher during HF-SCS compared to spontaneous breathing due to the higher absolute ribcage contribution to inspired volume. However, dorsoventral and rostrocaudal gradients of distribution of inspiratory drive observed during spontaneous activity were similar to those occurring during HF-SCS.

