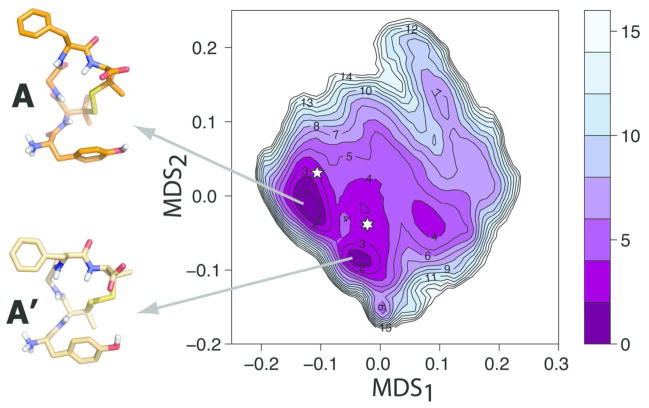
Figure 2. Free-energy surface of DPDPE solution.
Free-energy reconstructed from the bias-exchange metadynamics simulations of DPDPE in water. Free-energy differences from the lowest energy minimum A are reported in kJ/mol. Representative structures (cluster medoids) for minima A and A′ are reported in orange and light gold, respectively. The location on the map of representative, putative bioactive conformations is indicated with a six- or a five-point star for Clusters 1 and 2, respectively.

