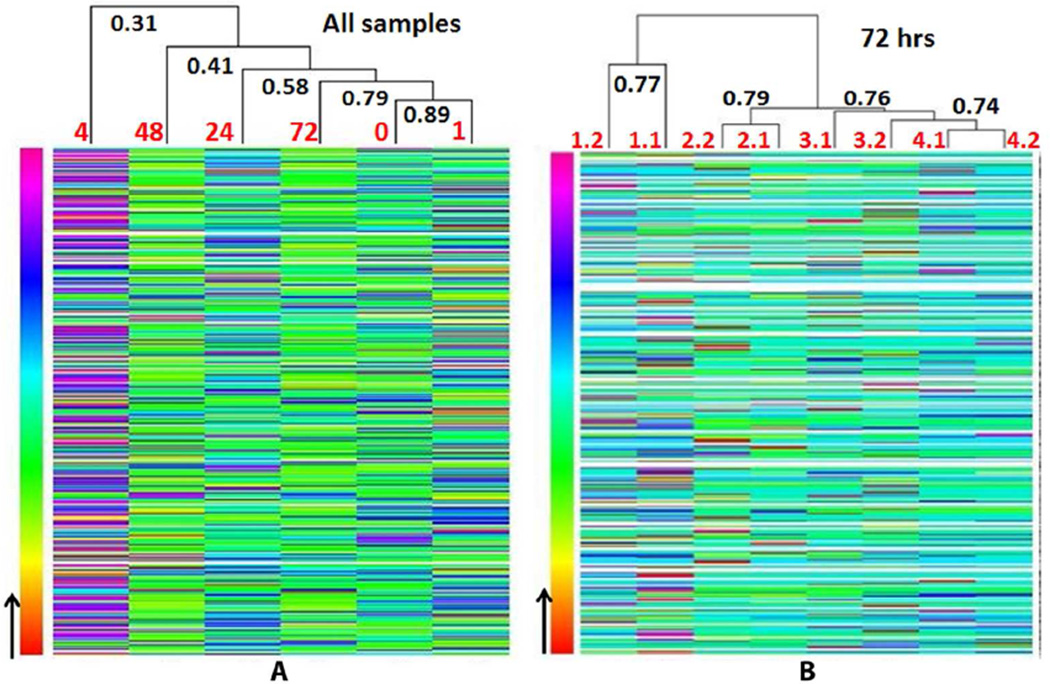
Figure 4. Heatmap of LC-MS/MS results.
(A) Correlation of protein abundance between different time points. The correlation between 0 hr and 72 hr is higher than the correlation between 0 hr and 4 hr, indicating that protein changes induced by isoproterenol peaked at 4 hr, then returned to normal ranges after 24 hr. (B) Correlation of protein abundance between technical replicates and biological replicates. 1.1 and 1.2, 2.1 and 2.2, 3.1 and 3.2, and 4.1 and 4.2 indicate two replicates from each of four biological samples, respectively. Correlation coefficient (R) is shown in bold.

