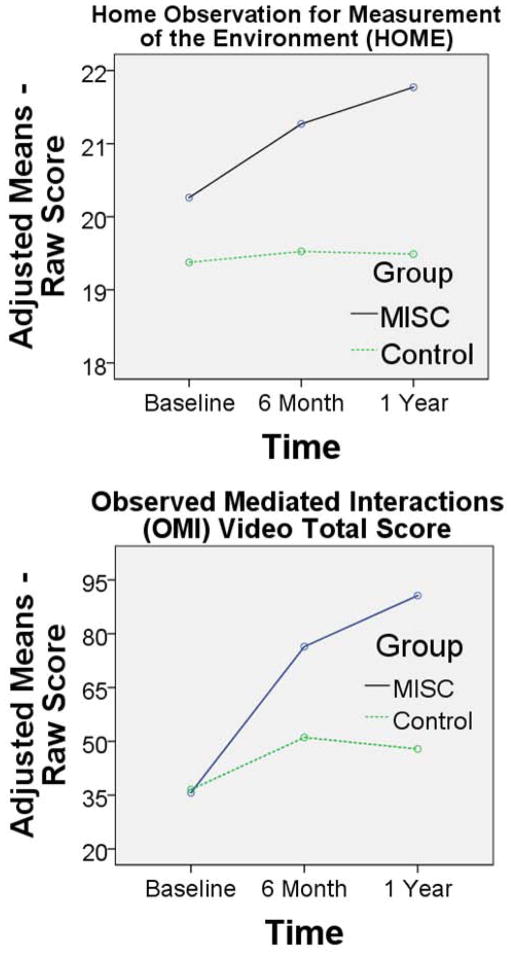
Figure 2.
Adjusted group mean score across the three time points (baseline, 6 months, 1 yr for the MISC (black, solid line) and control (green, dash line) caregiver training intervention groups. The means are adjusted according to the RM-ANCOVA model presented in Table II. The group (MISC, control) by assessment (baseline, 6 month, 1 year) adjusted mean plots are presented for the Mullen Composite Total score for the four cognitive scales (Fine Motor, Visual Reception, Expressive Language, Receptive Language).

