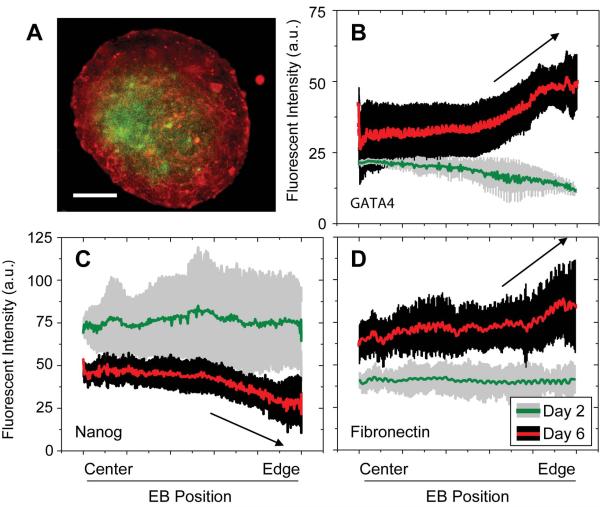
Figure 2. Fibronectin expression correlates with endoderm but not self-renewal markers in embryoid bodies.
(A) Immunofluorescent images of Nanog-controlled GFP (green) and fibronectin (red) were made at the widest confocal cross-section of EBs (CCE cell line) cultured in complete media. Custom image analysis software was used to determine the average fluorescent intensity from the EB center to the edge, summed together for all 360 degrees. Scale bar is 100 μm. (B–D) Protein distributions are shown for GATA4 (definitive endoderm), Fibronectin, and Nanog-controlled GFP at days 2 and 6 of EB culture (>50 EBs/group from 5 independent samples).

