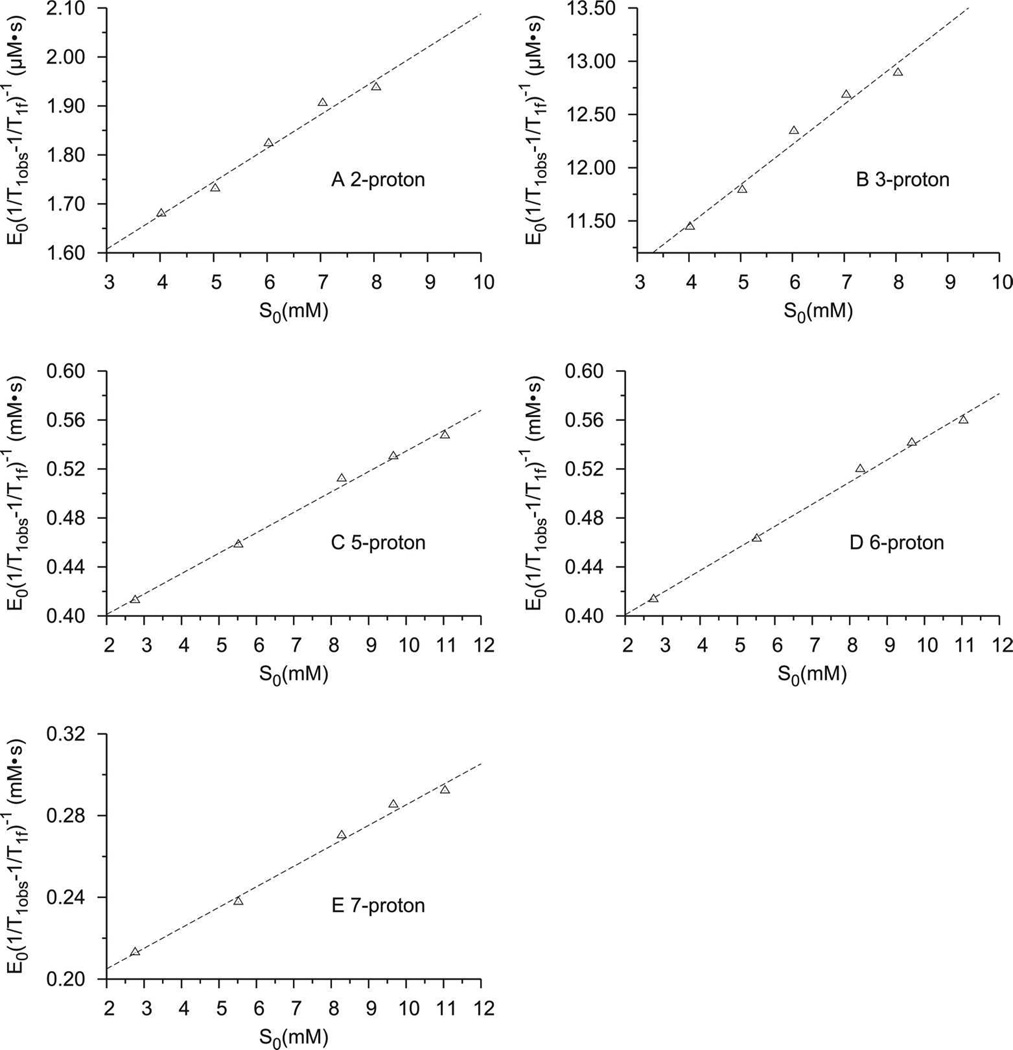
Figure 3.
The plots of E0[1/T1obs-1/T1f]−1 as a function of the concentration on indole (S0) for (A) 2-proton, (B) 3-proton, (C) 5-proton, (D) 6-proton, and (E) 7-proton of indole. The relaxation experiment were carried out (A-B) in 10 mM deuterated phosphate buffer containing 0.01 mM CPO and varying the concentration of indole, or (C-E) in 100 mM deuterated phosphate buffer containing 0.1 mM CPO and varying the concentration of indole. To plot the label on y axis clearly, E0[1/T1obs-1/T1f]−1 of (A) and (B) was plotted in the unit of µM•S.

