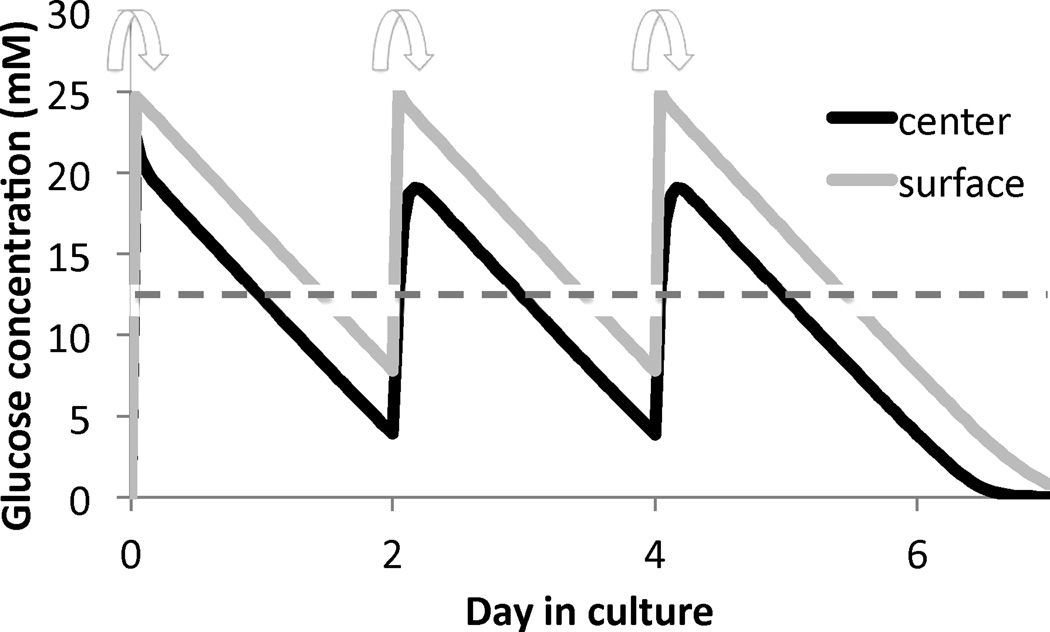
Figure 4.3.
Glucose concentration at the center and surface of the engineered cartilage construct, over time in culture. Arrows indicate times when culture media is refreshed. The dashed line represents the critical threshold in glucose concentration necessary for proteoglycan synthesis. Simulations were performed in the open-source, customizable finite element program FEBio (www.febio.org) Maas et al. (2012).

