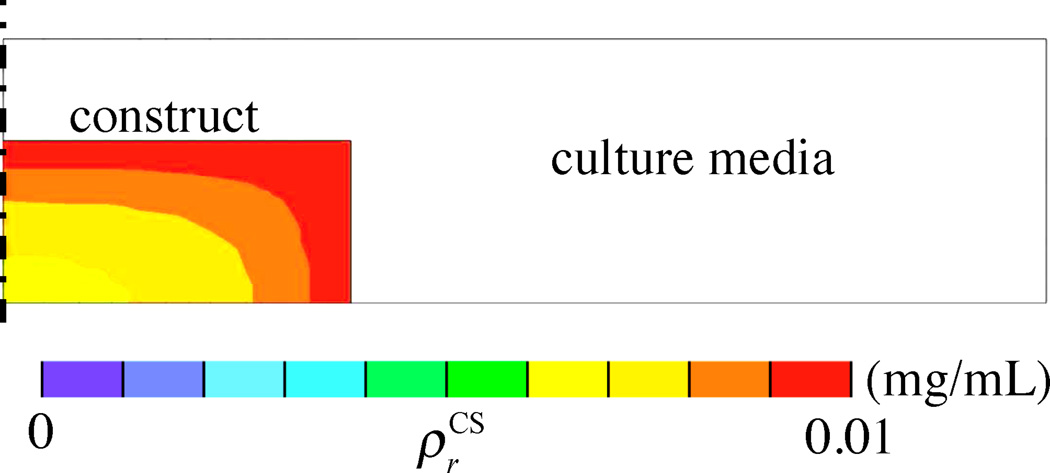
Figure 4.4.
Spatial distribution of chondroitin sulfate, , in the engineered cartilage construct at the end of one week. Predictions are based on the assumption that CS growth only occurs when glucose concentration exceeds the threshold value of 12.5 mM. Results only show a half-section of the construct and culture media bath, since axisymmetric conditions were assumed.

