
Figure 1.
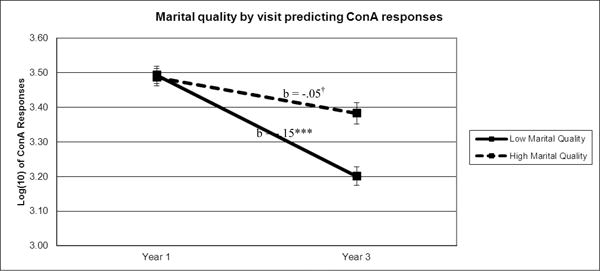
Note. To illustrate the relationship between marital quality and Con A responses over time, Con Aaverage values were graphed for participants 1 standard deviation above (high marital quality) and below (low marital quality) the mean of marital quality. Sample means were estimated using a model adjusted for BMI, age, and gender. †p≤.10, ***p≤.001