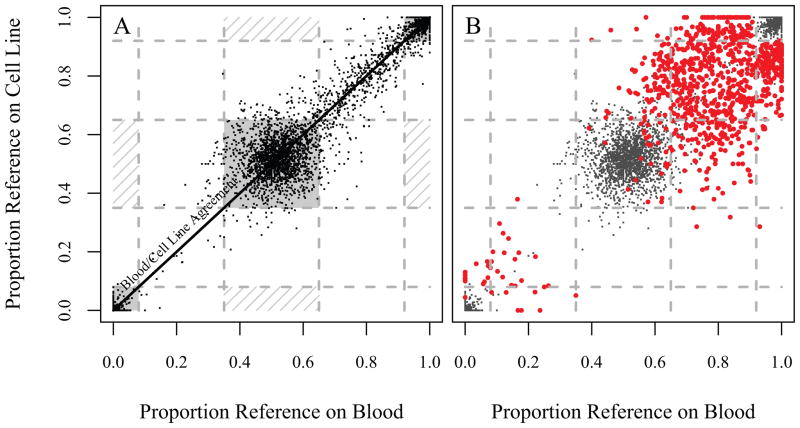
Figure 1.
Proportion of reference allele reads for blood versus cell line. A. A random sample of blood/cell line pairs that had matched calls. These are largely high-quality calls, and hence most of the points lie in the corners (for homozygotes) or in the center (for heterozygotes). These regions are shaded, and can be interpreted as the the areas which will contain the confident blood/cell line matches. The hashed regions are those where confident mismatches would be expected. Of course, as these are matches, most of these points lie near to the axis of blood/cell line agreement. B. The red dots represent the 864 blood/cell line disagreements, the gray are a subsample of the matches. Note that the mismatches largely fall in a region outside of where high-quality homozygote and heterozygote calls would be expected: in the corners and the center, respectively.

