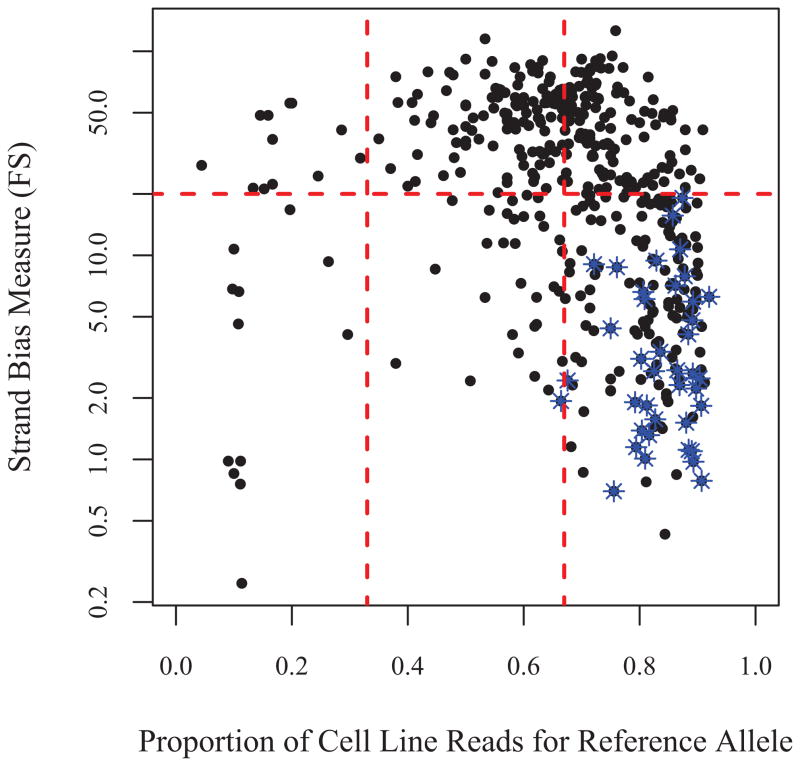
Figure 6.
Plot of strand bias (FS) versus proportion reference reads for the 484 heterozygous LCL calls among the candidates. Since each of these was called as homozygous on blood, these are all assumed to be either incorrect calls or mosaics on cell line. The mosaics are indicated by the blue stars. Most of these calls could have been filtered by constraining the proportion reference to be between 1/3 and 2/3, and ensuring that FS, the strand bias measure returned by GATK, is less than 20.

