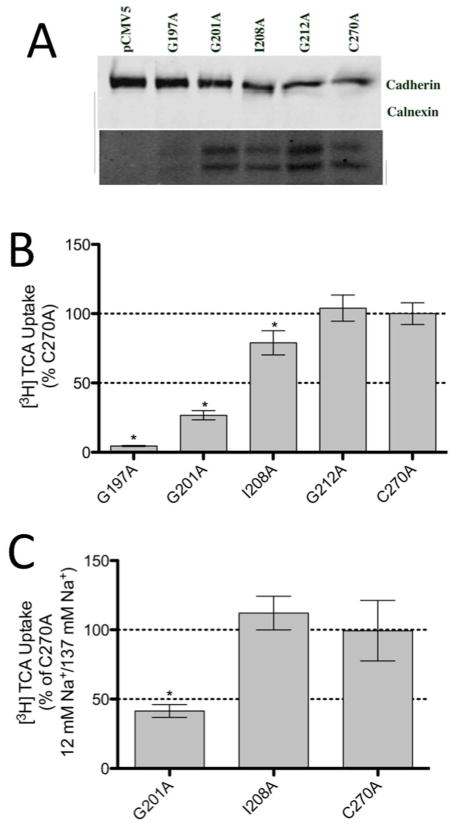
Figure 6.
[3H] TCA uptake and sodium sensitivity of select TM5 alanine mutants. A. Western Blot of TM5 alanine mutants expressed on the cell surface of COS-1 cells. ASBT is seen a two bands. Cadherin (140 kDa), expressed at the cell surface, was used as a positive loading control while Calnexin (90 kDa), expressed in the ER, was used as a negative control. B. Uptake of [3H] TCA expressed as a percentage of the parental transporter, C270A, in pmol [3H] TCA transported per minute per milligram of protein. C. Uptake of [3H] TCA in pmol [3H] TCA transported per minute per milligram of protein. The graph represents a ratio of uptake at 12 mM/137 mM sodium concentrations and normalized as a percentage of the parental transporter, C270A. Bars represent the S.D. of at least three separate experiments performed in triplicate. A significant difference was determined by an ANOVA calculation with p < 0.05 represented with an asterisk (*).

