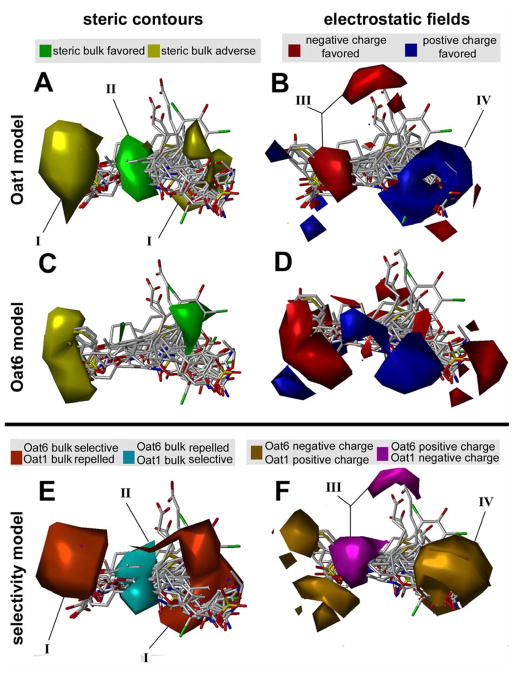
Figure 6.
A, B. Oat1 binding model. C, D. Oat6 binding model. E, F. Oat6/Oat1 selectivity model. A, C, E. CoMFA contour map for steric and B, D, F. electrostatic properties. For Oat1 and Oat6 steric field maps (A, C) green contours indicate areas where steric bulk is allowed and positively contributes to Oat1 pKi values, whereas yellow regions convey areas where steric bulk negatively impacts pKi. Oat1 and Oat6 electrostatic maps (B, D) feature blue contours where positive charge is favored, whereas more negative electron density is favored within red contours. The selectivity model CoMFA fields for Oat6 and Oat1 (E, F) suggest that Oat6 binding is favored with the presence or absence of bulk near orange or teal regions, and an increase of negative charge near the gold region or positive charge near purple regions. Conversely, the presence of bulk near teal and absence near orange regions, and increases in positive charge near gold and increases in negative charge near purple favors Oat1 inhibition. Oat6 selective ligands can be designed by introducing bulky groups near contours I, removing bulk near contour II, and placing groups with electropositive and electronegative density near contours III and IV, respectively. The training set molecules are shown in capped stick mode (red: oxygen, white: carbon, blue: nitrogen, green: halogens)

