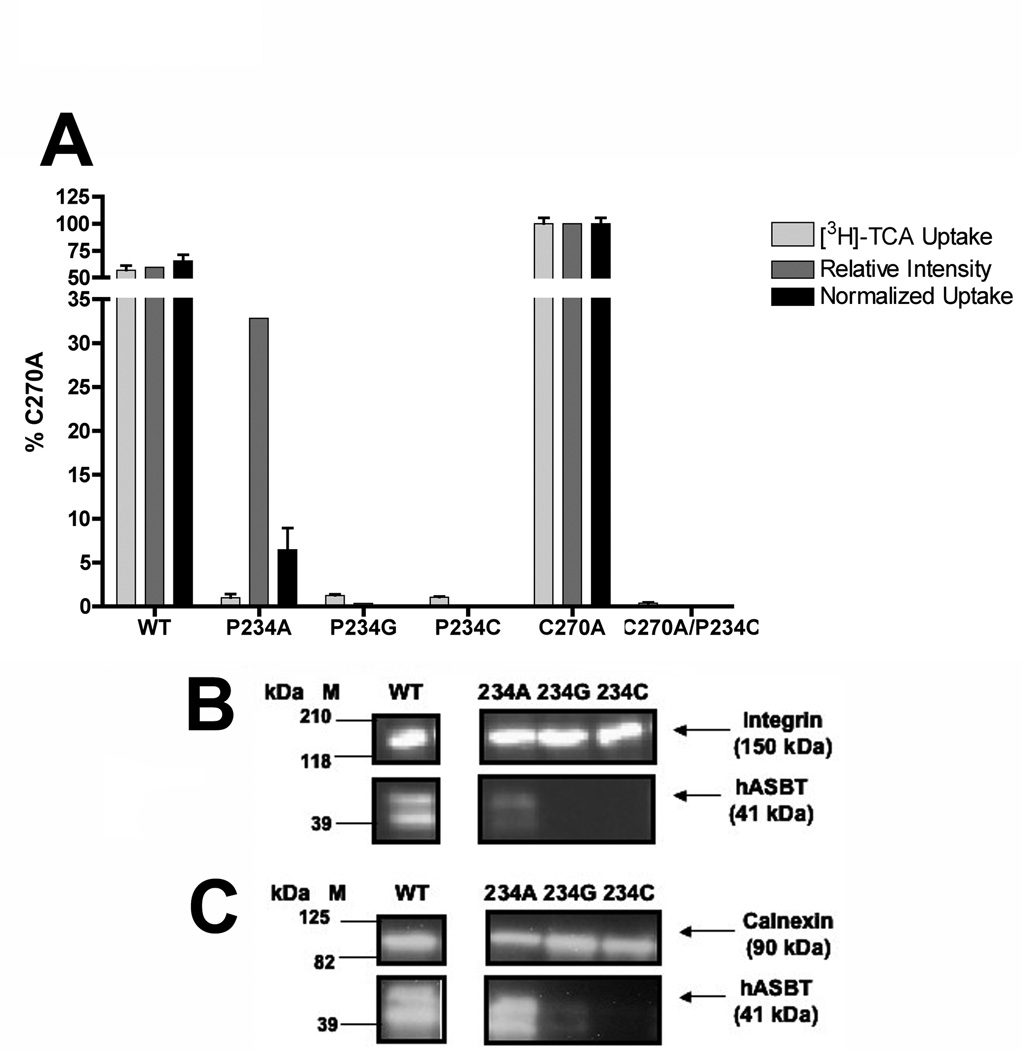
Figure 5. [3H]-TCA uptake and membrane expression of Pro234 mutants.
[A] The initial [3H]-TCA uptake (grey bars), relative intensity of immunoblotting (dark grey bars), and normalized uptake activities (black bars) for Pro234 single and double mutants and their parental templates are depicted. Bars represent mean ± S.D. of at least three separate measurements. Data expressed as percentage of C270A values for each condition. Student’s t-test analysis performed with *p < 0.05, **p < 0.01. Activities of the Pro234 constructs are statistically different that both WT and C270A (p < 0.01), however asterisks (**) have been omitted for visual clarity. [B] Intact transfected COS-1 cells were treated with sulfo-NHS-SS-biotin as described in “Materials and Methods” followed by Western Blot processing. Marker lanes are shown on the left side of the individual blots. Mature glycosylated hASBT visualizes as the 41kDa band while the lower, 38 kDa band (not indicated) represents the unglycosylated species; [C] Immunoblotting of whole cell extracts from transfected COS-1 cells as described in “Materials and Methods” showing glycosylated (41 kDa) and unglycosylated (38 kDa) hASBT species.

