
Figure 1.
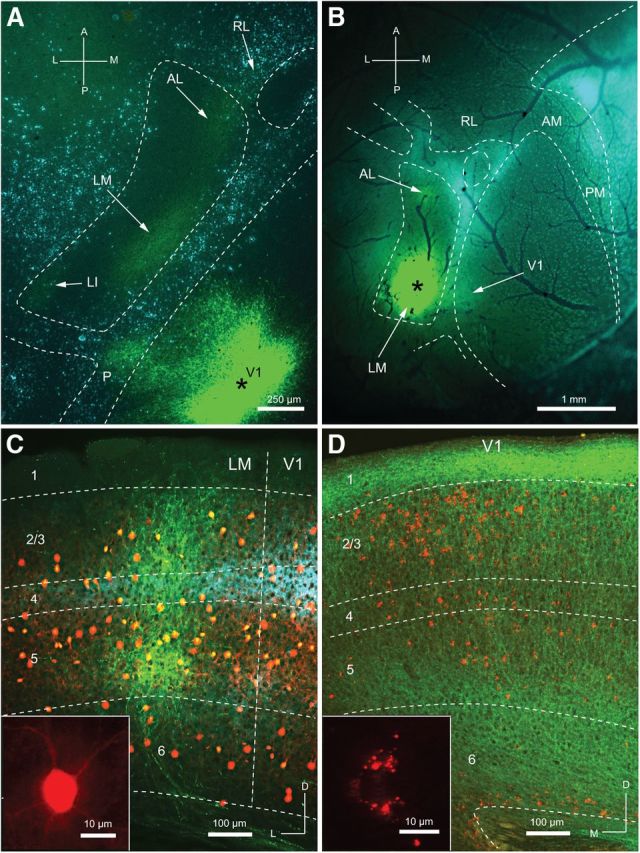
ChR2 expression in FF and FB pathways between V1 and LM. A, Section through layer 2/3 of flattened cerebral cortex showing ChR2 expressing FF connections from V1 to areas LM, AL, and LI. The asterisk marks the AAV2/1.CAG.ChR2-Venus.WPRE.SV40 injection site in V1. Arrows indicate ChR2-expressing terminal fields in LM, AL, and LI. Blue labeling represents callosally projecting neurons marked by retrograde transport of bisbenzimide from the opposite hemisphere. The dashed lines outline callosally connected cortex. Notice that areas LM, AL, and LI are contained in the large acallosal region lateral to V1. B, In situ image of ChR2 expression after AAV injection into LM (asterisk). Arrows indicate weakly labeled projections to V1 and AL. Blue labeling, outlined by the dashed lines, indicates callosally connected cortex. Dark branches represent blood vessels on the surface of the cortex. C, Coronal section showing ChR2-expressing FFV1→LM projection (green) terminating in layers 2/3, 4, and 5 of LM. Red cell bodies in layer 2–6 represent tdTomato-expressing PV neurons (yellow indicates overlap with ChR2-expressing fibers). Blue immunostaining represents m2AChR expression. Notice that the m2AChR-labeled band in layers 3 and 4 is wider in V1 than LM. The transition coincides with the V1/LM border. The inset shows uniform expression of tdTomato in a PV neuron. D, Coronal section showing ChR2-expressing FBLM→V1 projection (green) terminating most densely in layers 1, deep 5, and 6. Weaker projections terminate in layers 2/3, 4, and superficial 5. Retrobead-labeled neurons represent FFV1→LM-projecting Pyr cells. The inset shows the distinctive punctate pattern of retrobead labeling in layer 2/3 Pyr cells. A, anterior; M, medial; P, posterior; L, lateral; D, dorsal; RL, rostrolateral area; AM, anteromedial area; PM, posteromedial area.