
Figure 4.
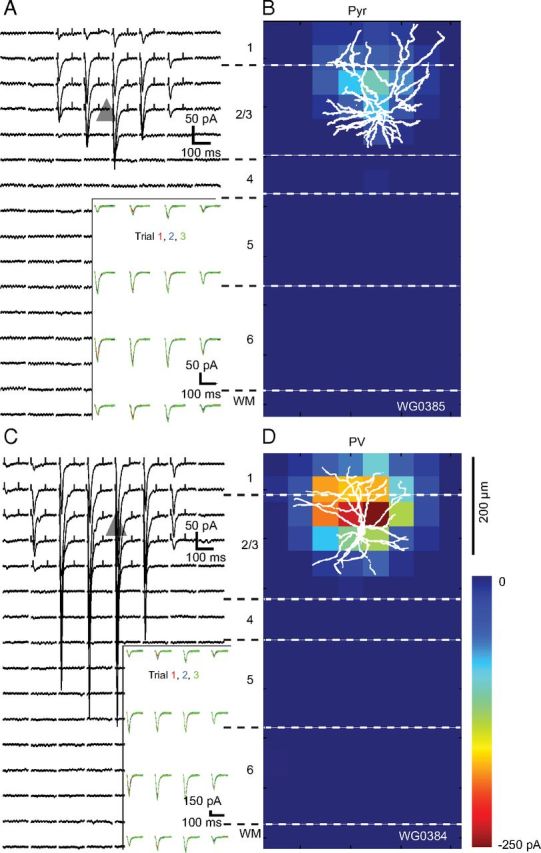
EPSCsCRACM maps of an FFV1→LM input to a pair of Pyr and PV neurons recorded in layer 2/3 of LM of the same slice. A, Whole-cell patch-clamp recordings of EPSCsCRACM from a retrobead-labeled FBLM→V1-projecting Pyr cell whose soma is represented by the gray triangle. Each trace corresponds to a response evoked by a laser photostimulus delivered to ChR2-expressing FFV1→LM axon terminals at specific locations of an 8 × 16 grid (50 μm spacing) aligned to the surface of cortex and extending across layers 1–6. Inset shows consecutive EPSCsCRACM, demonstrating that responses were reproducible across multiple trials. Ticks at the beginning and end of the traces indicate the window used for calculating the pixel values shown in the heat map shown in B. B, Heat map of FFV1→LM inputs to Pyr cell shown in A. The pixel values are proportional to the strength of synaptic input at a given location. The overlay of the biocytin-filled Pyr cell shows that the distribution of synaptic inputs largely coincides with the dendritic arbor. C, EPSCsCRACM map of FFV1→LM input to a nearby layer 2/3 PV neuron. Inset shows that responses were consistent across multiple trials. D, Shows the heat map of FFV1→LM responses from PV neuron, whose dendritic tree is well matched to the synaptically active region. Notice that FFV1→LM inputs to PV neuron are stronger than to the FBLM→V1-projecting Pyr cell.