
Figure 8.
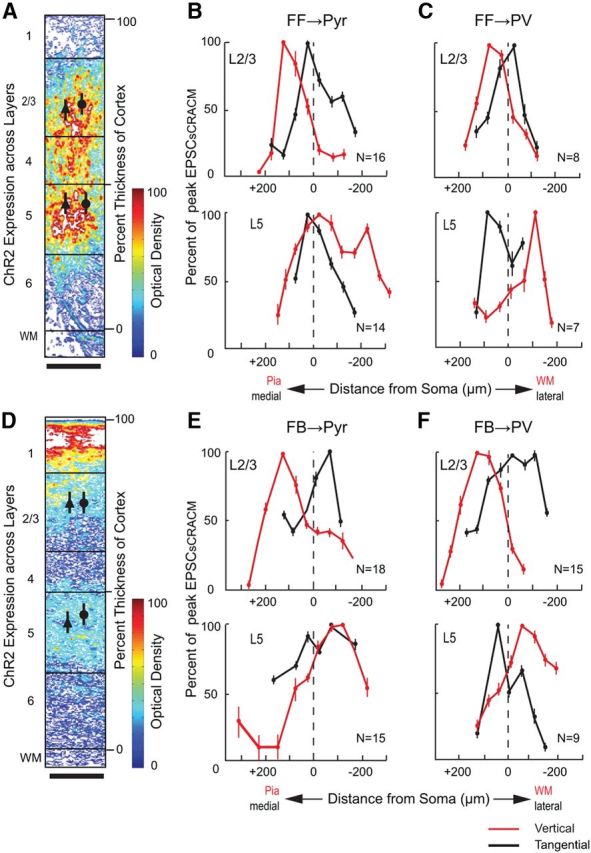
Vertical and horizontal extent of FFV1→LM and FBLM→V1 inputs to Pyr cells and PV neurons in layer 2/3 and 5. Optical density of ChR2-expressing FFV1→ LM (A) and FBLM→ V1 (D) inputs to different layers of V1 and LM, respectively. Mean (±SEM) EPSCsCRACM (scaled to peak response within layer), evoked by FFV1→LM and FBLM→V1 input to layer 2/3 and 5 Pyr cells (B, E) and PVs (C, F). Red lines indicate responses at different vertical locations. Stippled line indicates the location of the soma. Positive distances indicate sites approaching to the pia, negative distances point toward white matter (WM). Black lines indicate responses at different locations of the tangential plane. Positive indicates medial and negative indicates lateral. Scale bars: A, D, 100 μm.