
Figure 5.
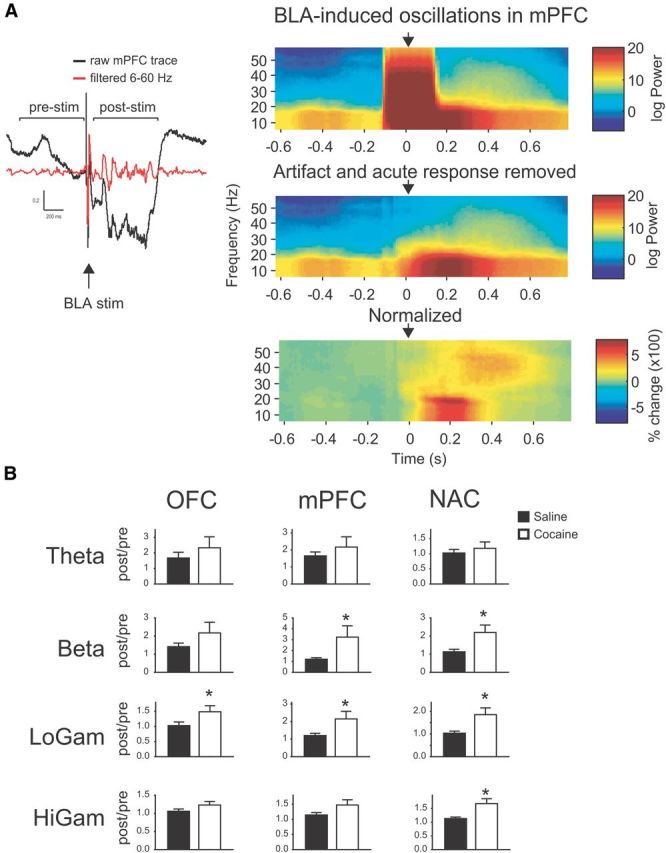
BLA-induced oscillations are enhanced in COC animals A, Left, Raw and filtered voltage traces from mPFC showing effects of acute BLA stimulation (arrow). Calibration: 200 ms, 0.2 mV. Induced oscillations were quantified by dividing power in the post-stim epoch by power in the pre-stim epoch, and then averaged over stimulus sweeps. Right, Time-frequency spectrograms showing effects of acute BLA stimulation (arrow) on raw voltage (top), traces with stimulus artifact and acute response removed (middle), and oscillation power normalized to mean prestimulus power (bottom). B, Induced oscillation power in each region according to frequency band. *, significantly different from SAL.