Figure 6.
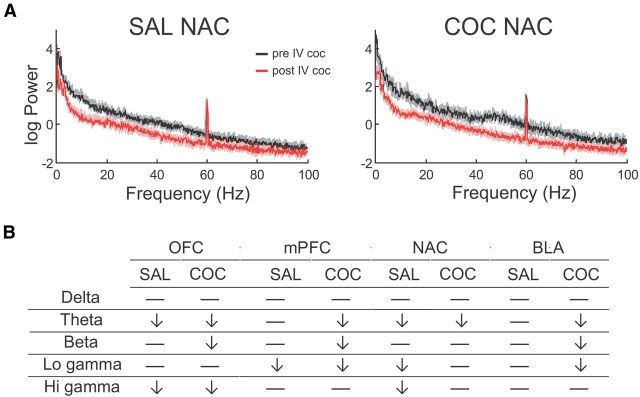
Cocaine challenge reduces spontaneous oscillation power in both SAL and COC groups. A, Representative NAC power spectrums for a SAL (left) and COC (right) animal before and after an acute 3 mg/kg intravenous cocaine challenge. Shaded area represents 95% confidence interval generated using jackknife statistics. B, Within-group effects of acute cocaine challenge on spontaneous LFP power according to region and frequency band. Arrows indicate a significant change from prechallenge baseline. Horizontal line represents no change.

