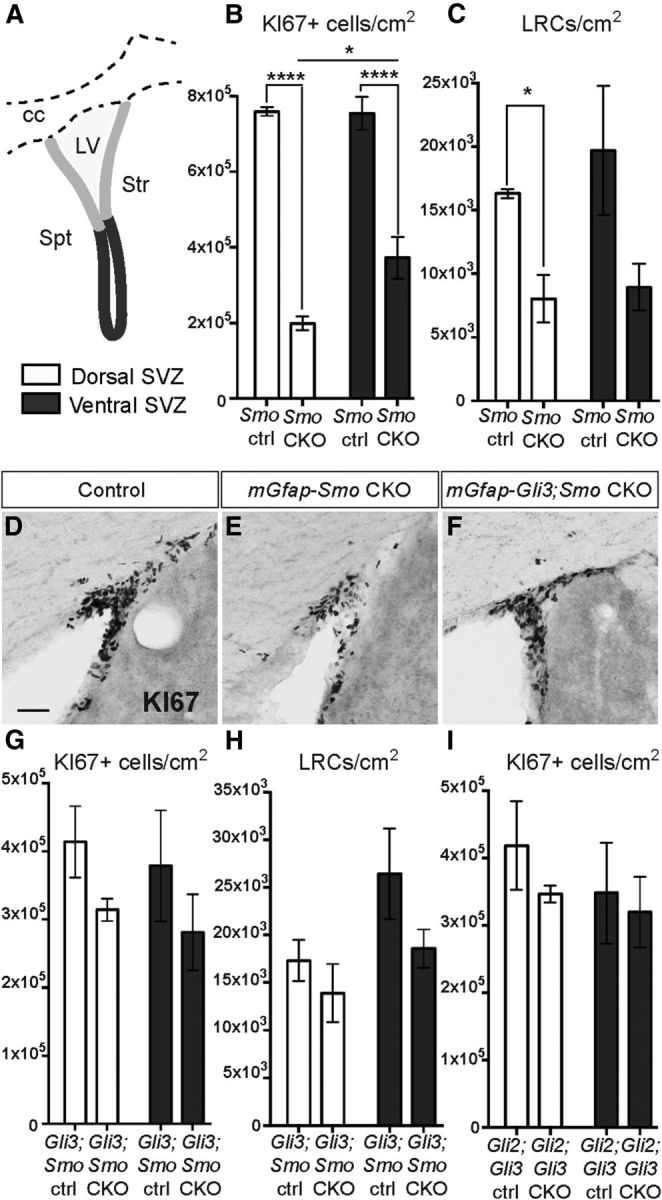
Figure 7.

GLIR upregulation compromises proliferation throughout the SVZ. A, Schematic diagram showing the dorsal (light gray) and ventral (dark gray) SVZ regions that were included in the analysis. Str, Striatum; Spt, septum; cc, corpus callosum; LV, lateral ventricle. B, C, Quantitative analysis of the number of KI67+ progenitors and LRCs per square centimeter in the dorsal (white bars) or ventral (gray bars) SVZ shows a significant decrease in the density of KI67+ progenitors in both regions of mGfap-Smo CKOs compared with Smolox/lox controls (Smo ctrl) that is more pronounced dorsally (B; n = 3 controls and 4 mutants; *p = 0.016, ****p < 0.0001; 2-way ANOVA with Sidak's post hoc test; mean ± SEM). A decrease in the density of the LRCs also was observed in the dorsal and ventral SVZ of mGfap-Smo CKOs compared with controls with no obvious change in the distribution between dorsal and ventral (C; n = 3 controls and 3 mutants). D–F, Dorsolateral SVZ sections stained for KI67 show a decrease in the number of KI67+ cells in the dorsal SVZ of mGfap-Smo CKOs when compared with controls (D, E), and a rescue of proliferation in the dorsal SVZ when Gli3 is ablated in mGfap-Smo CKOs (F). Scale bar: (in D) D–F, 50 μm. G, H, Quantitative analysis shows the recovery in the density of KI67+ progenitors and LRCs in mGfap-Gli3;Smo CKOs compared with controls (Gli3;Smo ctrl); as well as a similar distribution of KI67+ cells in the dorsal and ventral SVZ of mGfap-Gli2;Gli3 CKOs compared with controls (I) (Gli2;Gli3 ctrl; 2-way ANOVA with Sidak's post hoc test; mean ± SEM).
