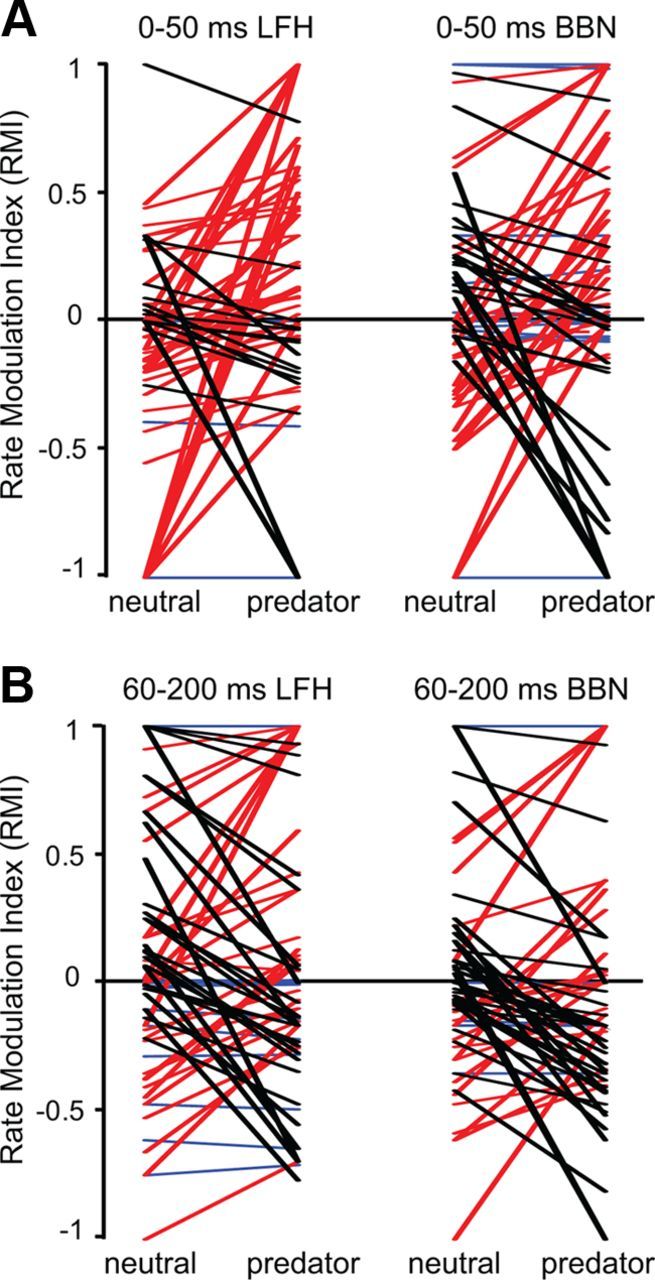
Figure 11.

Context-dependent modulation of auditory response rate in amygdalar neurons. The RMI expresses auditory-evoked firing rate; positive values reflect excitation and negative values reflect inhibition. For individual neurons, lines indicate the changes in RMI values with stimulus context; red lines represent neurons displaying a shift toward more positive RMI values in the predator context, black lines represent a negative RMI shift, and blue lines represent no change in RMI with predator context. A, In the early (0–50 ms) window, most neurons showed increased RMI values in response to the LFH call when the predator cue was presented, with many shifting from suppression to excitation. Across the population, the pattern of change in the BBN responses with a predator cue was not significant. The average magnitude of change did not differ between the LFH and the BBN responses. B, In the late (60–200 ms) window, there was no systematic direction of change in RMI for the LFH or the BBN responses when the predator cue was presented.
