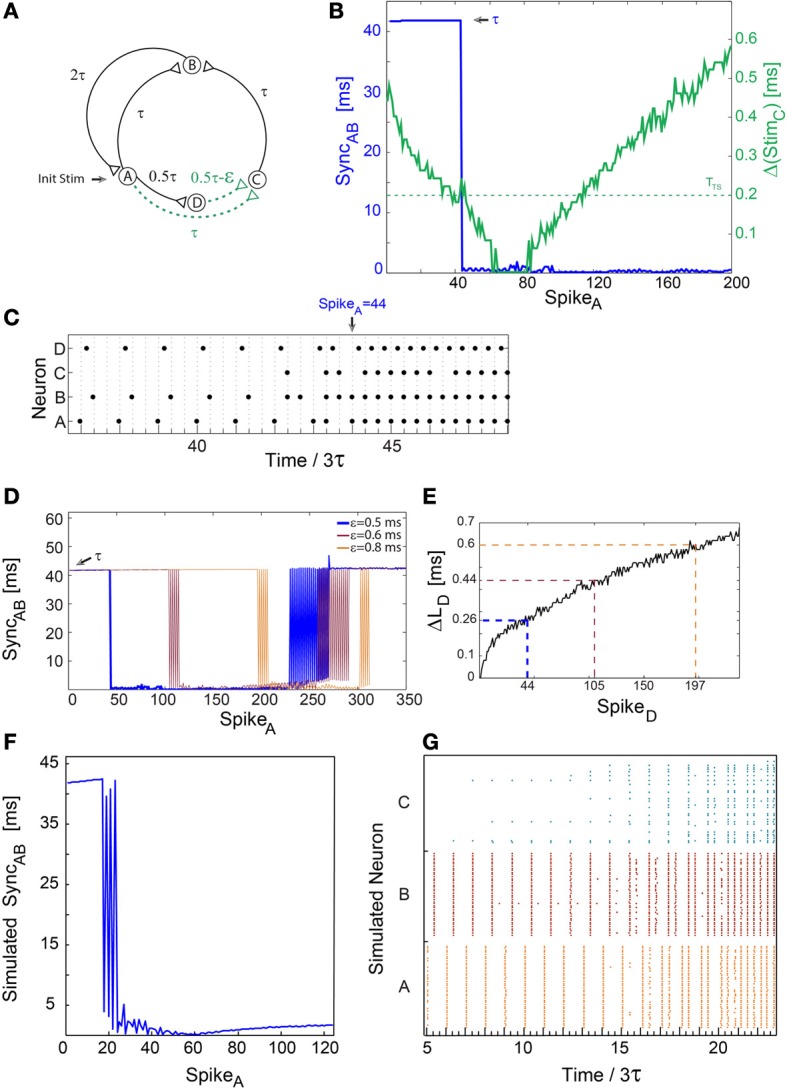
Figure 2.

A sudden leap to synchrony accompanied by tripled frequency. Notations used: SyncAB, the absolute time-lag between the spikes of neurons A and B; Δ(StimC), the absolute time difference between two weak stimulations to neuron C; ΔLD, the increase in response latency of neuron D after n evoked spikes. (A) Schematic of a neuronal circuit as in Figure 1A, however, the delay from neuron B to A is now 2τ. (B) Experimental measurements of Δ(StimC), similar to Figure 1B, with ε ≈ 0.5 ms, 3τ = 125 ms and TTS ≈ 0.2 (presented by the dashed horizontal green line). SyncAB, (blue line) indicating a sudden leap from τ ≈ 125/3 ms to nearly zero-lag synchronization. (C) Spike trains of the four neurons. A sudden leap to synchronization, SyncAB ≈ 0, occurs at time/3τ = 44 (at spike 44 of neuron A) consecutive to three evoked spikes of neuron C. This is accompanied by tripled firing frequency of neurons A and B, from ~8 to ~24 Hz. SyncAB ≈ 0 is robust to response failures of neuron C, e.g., time/3τ = 46.33. (D) SyncAB as a function of the spikes of neuron A for various ε, where the number of spikes to the leap to synchrony increases with ε. The data for ε = 0.5 (blue) is the same as in (B,C). The observed oscillations in SyncAB before a leap to synchrony originate from response failures of neuron C, and similarly oscillations in a leap out of synchrony originate from response failure of either neuron A or B. (E) ΔLD, for repeated stimulations at 8 Hz. ΔLD at the leap for different ε are indicated and colored following (D), approximately verifying Equation (1), e.g., for ε = 0.8 ms and TTS ≈ 0.2 ms, ΔLD(197) gives ~0.6 ms. Note that SpikeD is equal to SpikeA in (B,D). (F) Results of population dynamic simulations similar to Figures 1F,G with ε = 2 ms, TTS ≈ 1.3 ms and 3τ = 125 ms. (G) Raster plot of the 120 neurons comprising nodes A, B, and C. A leap to synchrony occurs at time/3τ ≈ 20, accompanied by tripled firing frequency.
