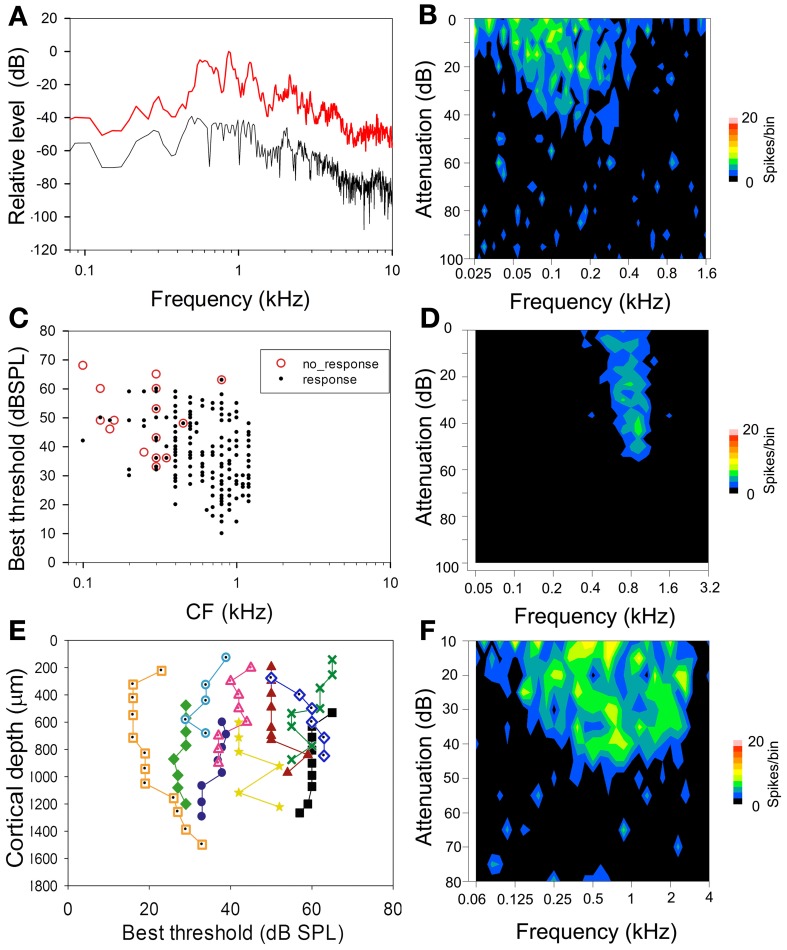
Figure 1.
(A) High resolution spectral analysis of the chutter based on the mean of 50 ms segments of the three main phrases in the call. The graphs show the maximum (red) and minimum (black) sound levels for each frequency plotted relative to the loudest sound level in the call. Most of the energy is contained within the frequency range 0.5–1.5 kHz and this is the range of CFs for most of the units selected in this study. (B) Frequency response area (FRA) of a unit with a CF of 0.13 kHz which did not respond to the chutter call. (C) Distribution of CFs and best thresholds of the units recorded in this study. The red circles indicate units which did not respond to the chutter call. There is a broad range of thresholds for units at each CF. The unresponsive units have a CF of below 0.4 kHz or a high threshold. (D) Narrowly tuned FRA from a unit with a CF of 0.8 kHz that responded reliably to the chutter call. (E) Line plots of changes in the best threshold of units in 10 separate orthogonal tracks. Overall there is a range of about 50 dB in the best thresholds shown, but the thresholds don't vary by more than 20 dB in any one track. (F) Broadly tuned FRA from a unit with a CF of 0.7 kHz that showed a strong response to the chutter and illustrates the fact that CF, best threshold and width of tuning may all be factors in determining to what degree a unit responds to the chutter call.

