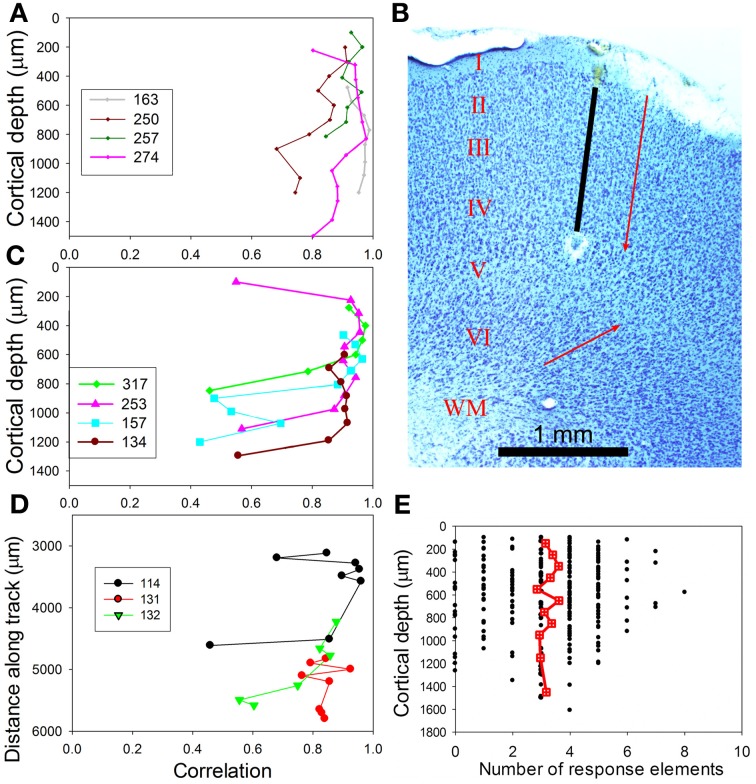
Figure 11.
(A) Similarity of recorded responses in tracks across AI(LF). For any one track the mean PSTH was correlated with the individual responses and the correlation values plotted against the distance along a track. These four tracks were oriented in a direction orthogonal to the cortical surface and were representative of eight tracks that mainly showed similar values over a distance of about 1 mm. (B) Coronal section through AI(LF), stained for Nissl substance and showing the position of an orthogonal electrode track (black line) that has been extrapolated between the blood filled start of the track and an electrolytic lesion at the upper edge of layer V. The parallel red arrow indicates the orientation of the stacks of cells separated by bundles of myelinated fibers that indicate the orientation of cortical microcolumns in the outer layers. The red arrow pointing obliquely upwards indicates the orientation of cell columns in the deep layers. The cortical layers are indicated by Roman numerals and the white matter by WM. Part of layer I, above the red arrow, was injured during the experiment. (C) A further four orthogonal tracks that all show at least one sudden change in the type of response. (D) Three tangential tracks that also show a sudden change in response type if the track extends for more than about 1 mm. (E) Scattergram plot showing the number of elements in chutter that units respond to over the range of depths sampled. The red square/cross symbols joined by a line indicate the running mean values for the number of elements and these remain fairly constant over the depth of AI(LF) sampled.

