Figure 12.
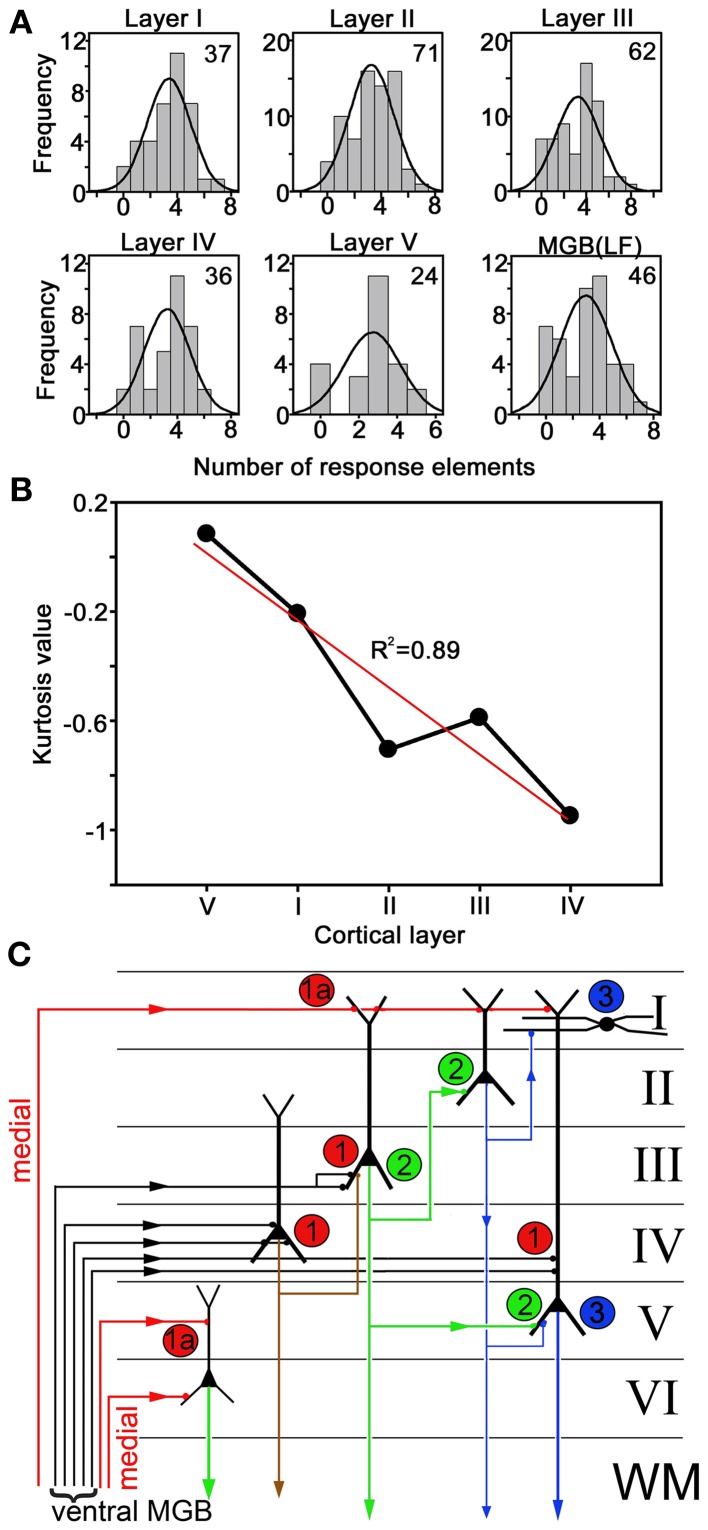
(A) Units were assigned to a cortical layer based on their depth and the number of units responding to a given number of call elements was plotted as a histogram and compared to a normal distribution. The relatively small number of units recorded from each layer (number in upper right hand corner of each panel) meant that the distributions were not perfectly normal, but it was possible to calculate a value for how flat the distributions were (kurtosis). (B) Plot of kurtosis values for the distributions of response frequency to a particular number of call elements versus the cortical layer. When the layers were arranged in functional distance from layer IV there was a linear relationship. The regression line (red) had an R2 value of 0.89. (C) Simplified diagram showing some of the main excitatory connections in the auditory cortex. The main thalamic inputs from the ventral MGB are thought to terminate on a variety of cells in layer IV and the base of layer III (labeled 1) whereas the inputs from the medial MGB (labeled 1A) mainly terminate in layers I, V, and VI. Layer IV pyramidal cells project into layer III whereas layer III pyramidal cells project to layers II and V (labeled 2). Layer II pyramidal cells project to layer I and layer V (labeled 3).

