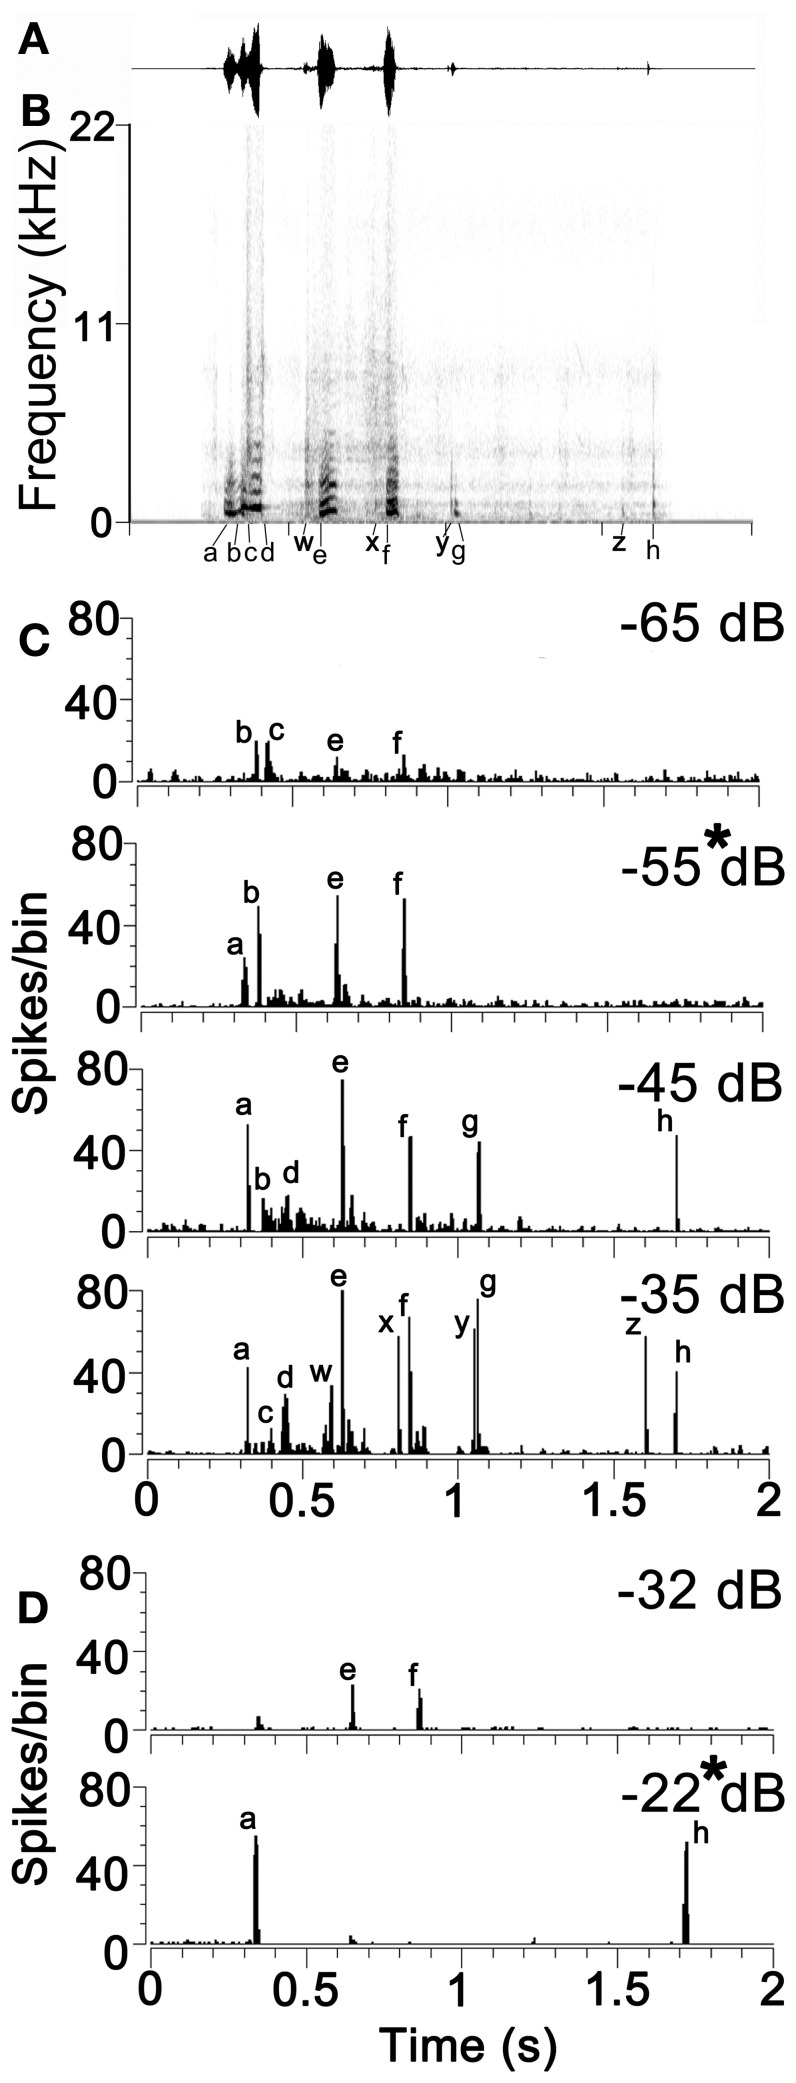
Figure 2.
(A) The waveform and (B) the spectrogram of the example of chutter used in this study. The eight temporal elements of the call that are capable of producing a neuronal response at low sound levels are indicated by the letters (a) to (h) below the time axis. Quieter elements of the call that only produce a neuronal response at relatively high sound levels are indicated by the letters (w) to (z). (C) Responses of a unit in AI(LF) to the chutter call presented at four different attenuation levels from −65 dB (quietest) to −35 dB (loudest). Individual peaks in the response corresponding to the different temporal elements of the spectrogram are indicated by the same letters as in panel (B). This unit had a CF of 1 kHz and a pure tone threshold of 25 dB SPL. (D) Separate unit in AI(LF) which showed different responses to chutter at two different levels of attenuation. This unit had a CF of 0.4 kHz and a pure tone threshold of 58 dB SPL.

