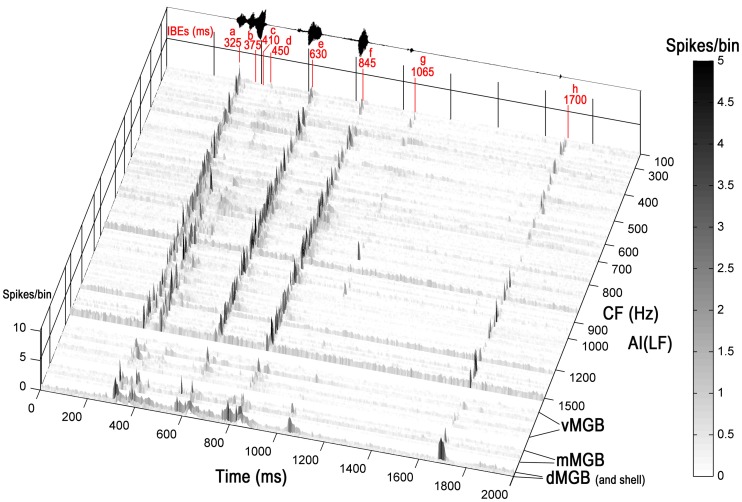
Figure 3.
Three-dimensional heat plot of the firing rate for all the units in the cortex and thalamus arranged in tonotopic order. Units from three divisions of the MGB are shown at the base of the figure and each division is separated by a white line. At the top of the plot there is a representation of the call waveform and the position of the eight acoustically distinct elements is indicated along with their mean latency relative to the start of the stimulus file given in ms. Most units respond by giving brief increases in their firing rate at times that correspond to one or more of the elements in the call. The firing rate is given as spikes/bin/stimulus repeat.

