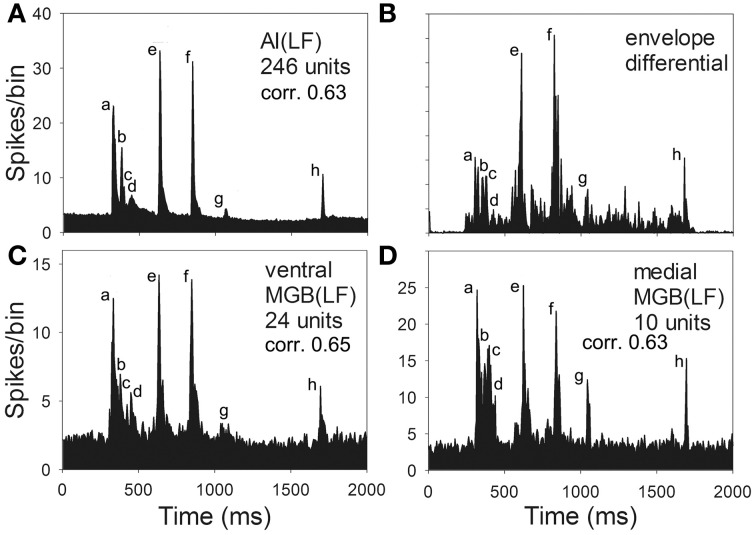
Figure 8.
Mean response to chutter derived from the population of low-frequency units (CF <1.5 kHz) recorded in (A) AI(LF) (C) ventral and (D) medial MGB. The mean responses all look similar to each other and to the first differential of the waveform envelope shown in panel (B). The correlation values between each of the population responses and the first differential are also very similar.

