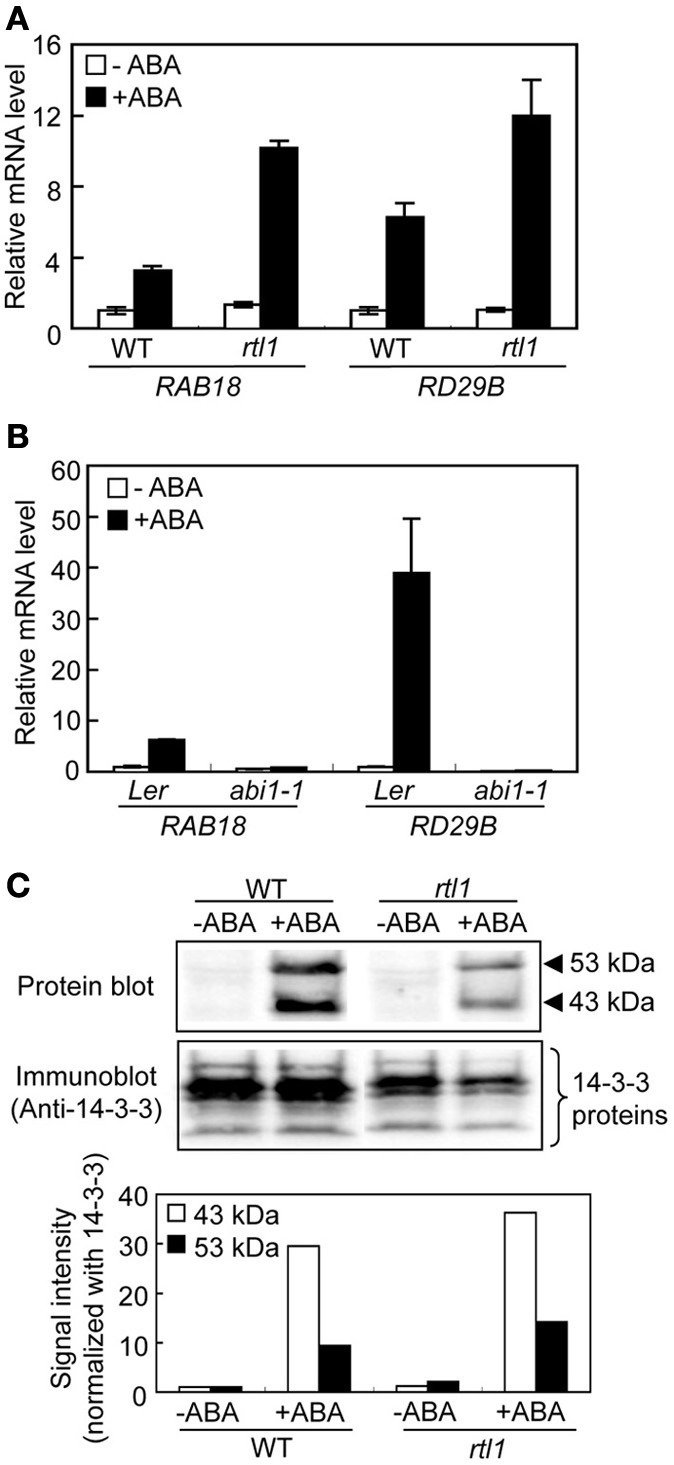
Figure 1.

ABA-responsive gene expression and ABA-induced phosphorylation of bHLH transcription factors (the AKSs) in guard cells from the rtl1 mutant. (A) The expression levels of ABA-responsive genes, RAB18 and RD29B, in GCPs from WT and rtl1 mutant plants, measured using real-time quantitative PCR. Transcript levels were normalized to that of TUB2. GCPs were incubated in the presence or absence of 20 μM ABA for 1 h. Data represent the means of three measurements ± standard deviations (SDs). (B) Expression of ABA-responsive genes in GCPs from abi1-1 and Ler plants. The experimental conditions were as described in (A) above. (C) ABA-induced protein phosphorylation in GCPs from WT and rtl1 plants. Phosphorylation of 43- and 53-kDa proteins was detected via protein blot analysis using GST-fused 14-3-3 protein as a probe (“Protein blot”), and endogenous 14-3-3 proteins were detected by immunoblotting using an anti-14-3-3 protein antibody (“Anti-14-3-3 protein”). GCPs were incubated in the presence or absence of 20 μM ABA for 10 min. The lower panel shows the relative phosphorylation levels of the AKSs, and the 43- and 53-kDa proteins, quantified by calculating the ratios of the signal intensities of the protein blot bands to those of immunoblot bands of 14-3-3 proteins. The data are expressed relative to the level of phosphorylation in ABA-untreated WT plants. The experiment was repeated twice on different occasions and yielded similar results.
