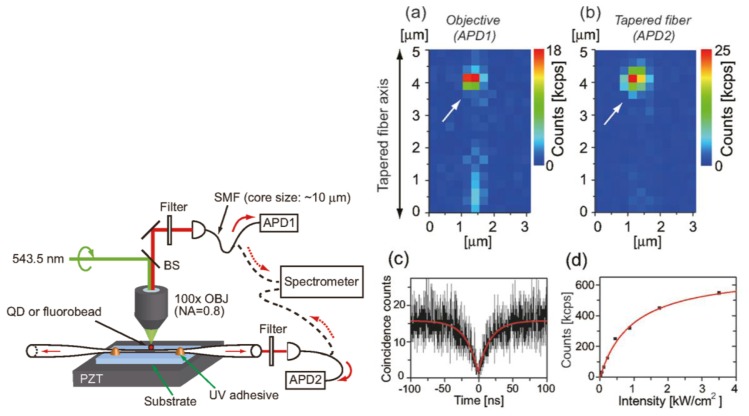
Figure 15.
(Left) Schematic illustration of the setup. Note that the detection method was changed from APDs to a spectrometer, depending on the experiment. (Right) Scanning images of quantum dots on the ONF using (a) an objective and (b) an ONF. The quantum dot is next to the white arrow. (c) Second order photon correlation measurements. (d) Photon count from the quantum dot as a function of excitation laser intensity. Reprinted with permission from [101]. Copyright 2011 American Chemical Society.

