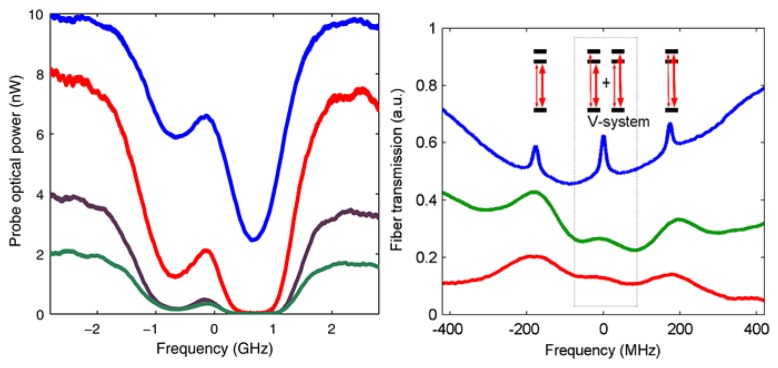
Figure 9.
(Left) Transmission spectrum for a nanofiber in a vapor cell for increasing probe powers (2, 4, 8, and 10 nW) for the Rb D2 transition; (Right) Saturated absorption spectrum with cross-polarized pump and probe beams for a Rb vapor cell (upper, blue) and a Rb nanofiber system (middle, green and lower, red) for the D1 manifold of 85Rb. The two side peaks correspond to the Doppler-free F = 3 → F' = 2 and F = 3 → F' = 3 hyperfine transitions. The center peak represents a V-system EIT signal. Reprinted with permission from [77]. Copyright 2008 American Physical Society.

