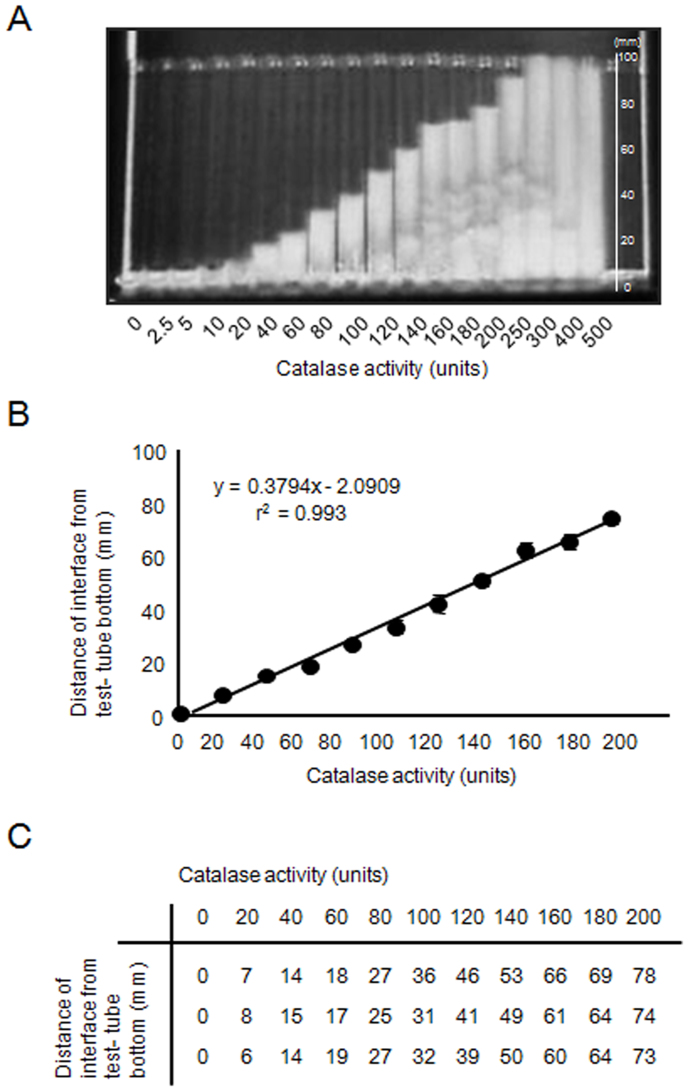
Figure 1. Image showing the height of foam developed in each test tube following the reaction of catalase with hydrogen peroxide, and the calibration curve plotted using the defined unit of catalase activity.
(A) Image of test tubes showing foam developed as a result of catalase activity. Each solution of concentration of catalase (100-μL) was added in a Pyrex tube (13 mm diameter × 100 mm height, borosilicate glass; Corning, USA). Subsequently, 100 μL of 1% Triton X-100 and 100 μL of undiluted hydrogen peroxide (30%) were added to the solutions and mixed thoroughly and were then incubated at room temperature. Following completion of the reaction, the height of O2-forming foam in the test tube was measured using a ruler. (B) The best linear fit between the foam heights and catalase activity was observed over a range of 20–200 U (y = 0.3794x − 2.0909, r2 = 0.993). Mean values are shown (n = 3). Error bars represent the standard deviation. (C) The height of foam generated after mixing catalase, Triton X-100, and H2O2.

