
Figure 1.
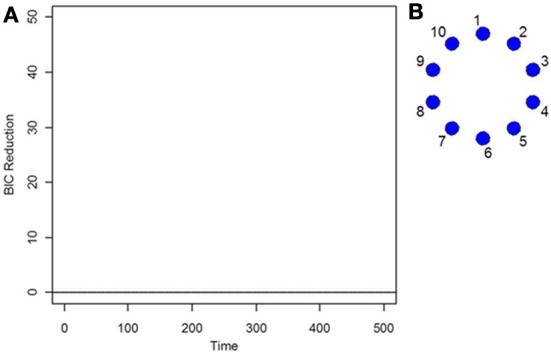
(A) The splitting times plotted against BIC reduction for the i.i.d data set (simulation 1) using the new DCR. (B) The corresponding undirected graph for this data set.
Official websites use .gov
A
.gov website belongs to an official
government organization in the United States.
Secure .gov websites use HTTPS
A lock (
) or https:// means you've safely
connected to the .gov website. Share sensitive
information only on official, secure websites.
(A) The splitting times plotted against BIC reduction for the i.i.d data set (simulation 1) using the new DCR. (B) The corresponding undirected graph for this data set.