
Figure 2.
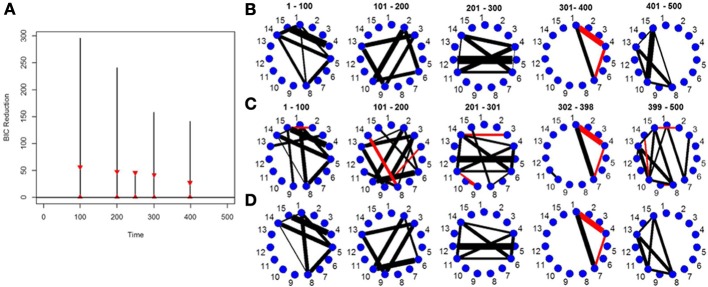
(A) The splitting times plotted against BIC reduction for the VAR data set with four connectivity change points (simulation 2) using the new DCR algorithm. The vertical black lines represent the BIC reduction at the particular time point and the red triangles represent the 0.975 and 0.025 empirical quantiles of the BIC reduction based on 1000 stationary bootstrap relications of the data for each split. (B) The true undirected graphs for each partition. The undirected graphs for this data set using the new DCR and (C) no inference on the edges and (D) inference on the edges.